
Cost-Burdened Households
Households that spend more than 30% of their income on housing are considered cost-burdened and may not have money for necessary expenses such as food, clothing, or transportation. Cost-burdened households have a lower quality of life and are less equipped to navigate unexpected financial crises. Ensuring that all residents have access to affordable housing creates a more prosperous and equitable Louisville.
Peer City Perspective
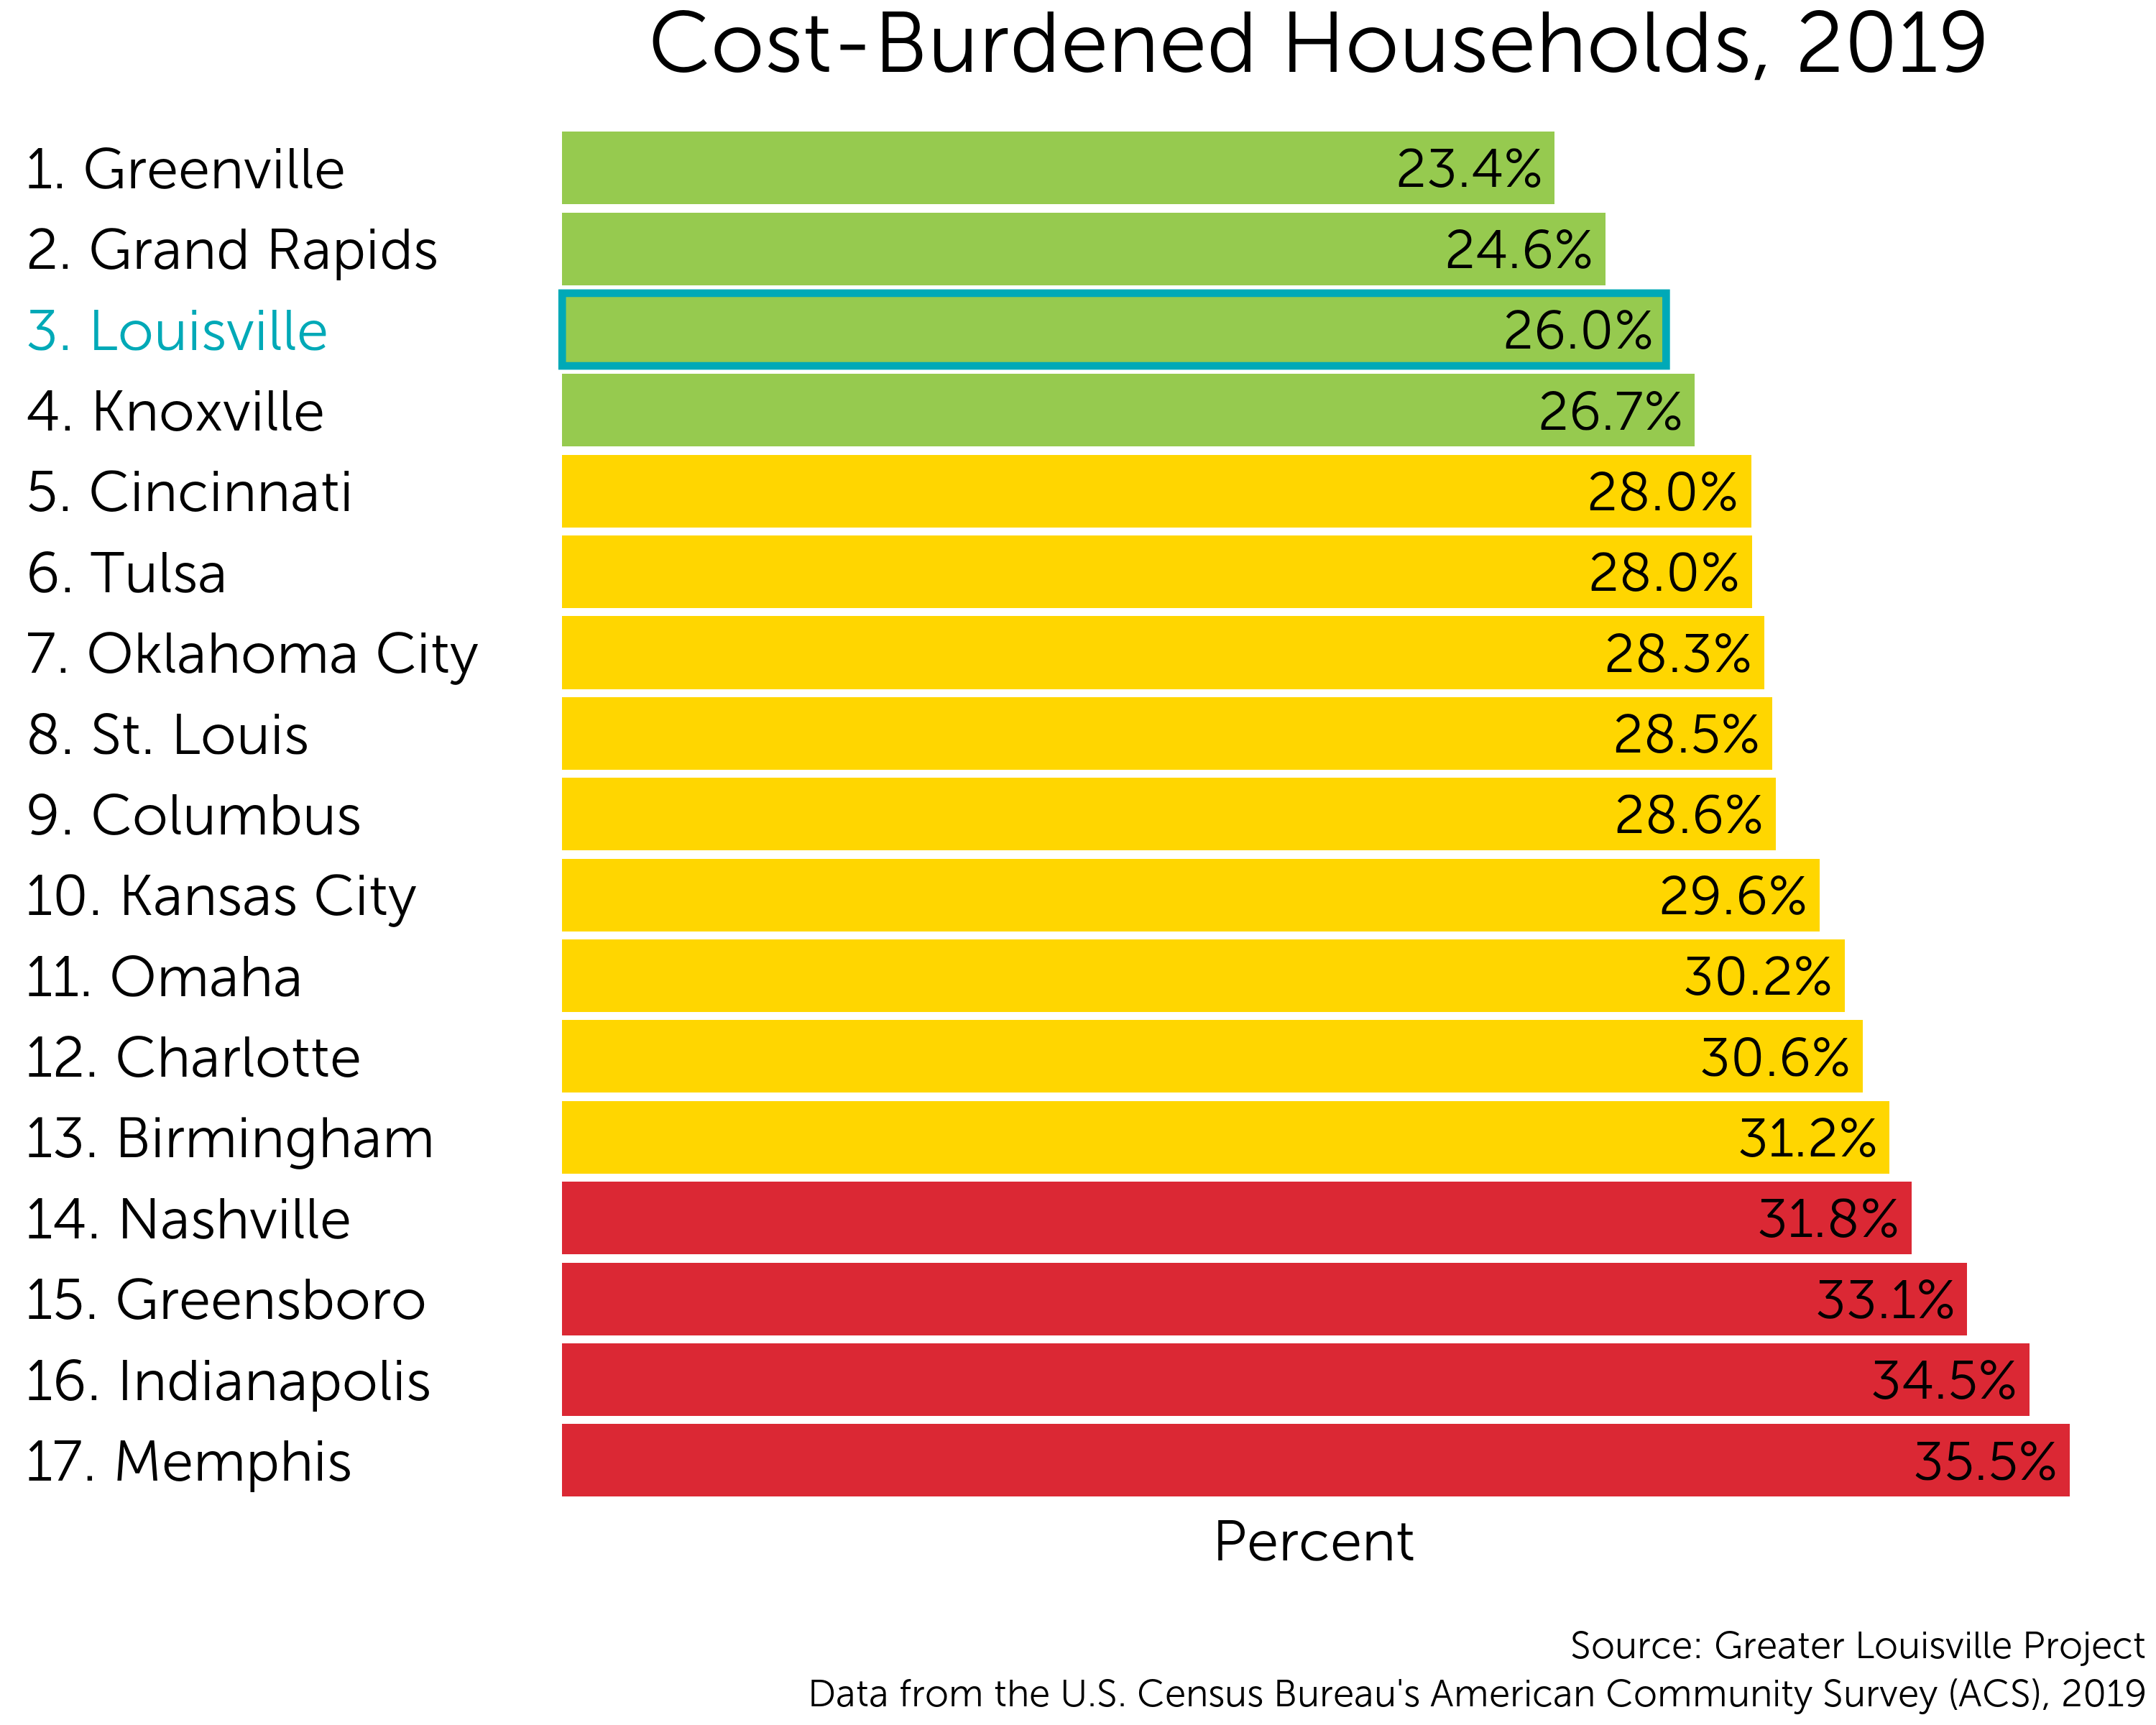
Louisville currently ranks 3rd among its peers in the percentage of households that spend 30% or more of their income on rent or mortgage expenses.
That puts Louisville in the top tier of its peers according to a natural breaks algorithm. Cities in green are those that outperform their peers. Cities in yellow represent the middle cluster, and those in red lag behind their peers on this indicator.
Where are the cost burdened homes in Louisville?
Neighborhoods with high incomes tend to have the lowest percentages of cost-burdened homes: only 12% of Belknap residents in the Highlands and 15% of Eastwood-Long Run residents in East Louisville live in unaffordable housing. Neighborhoods in West Louisville and around the University of Louisville have the highest rates of cost-burdened households. In the California neighborhood, 55% of households are cost-burdened.
Trends over Time
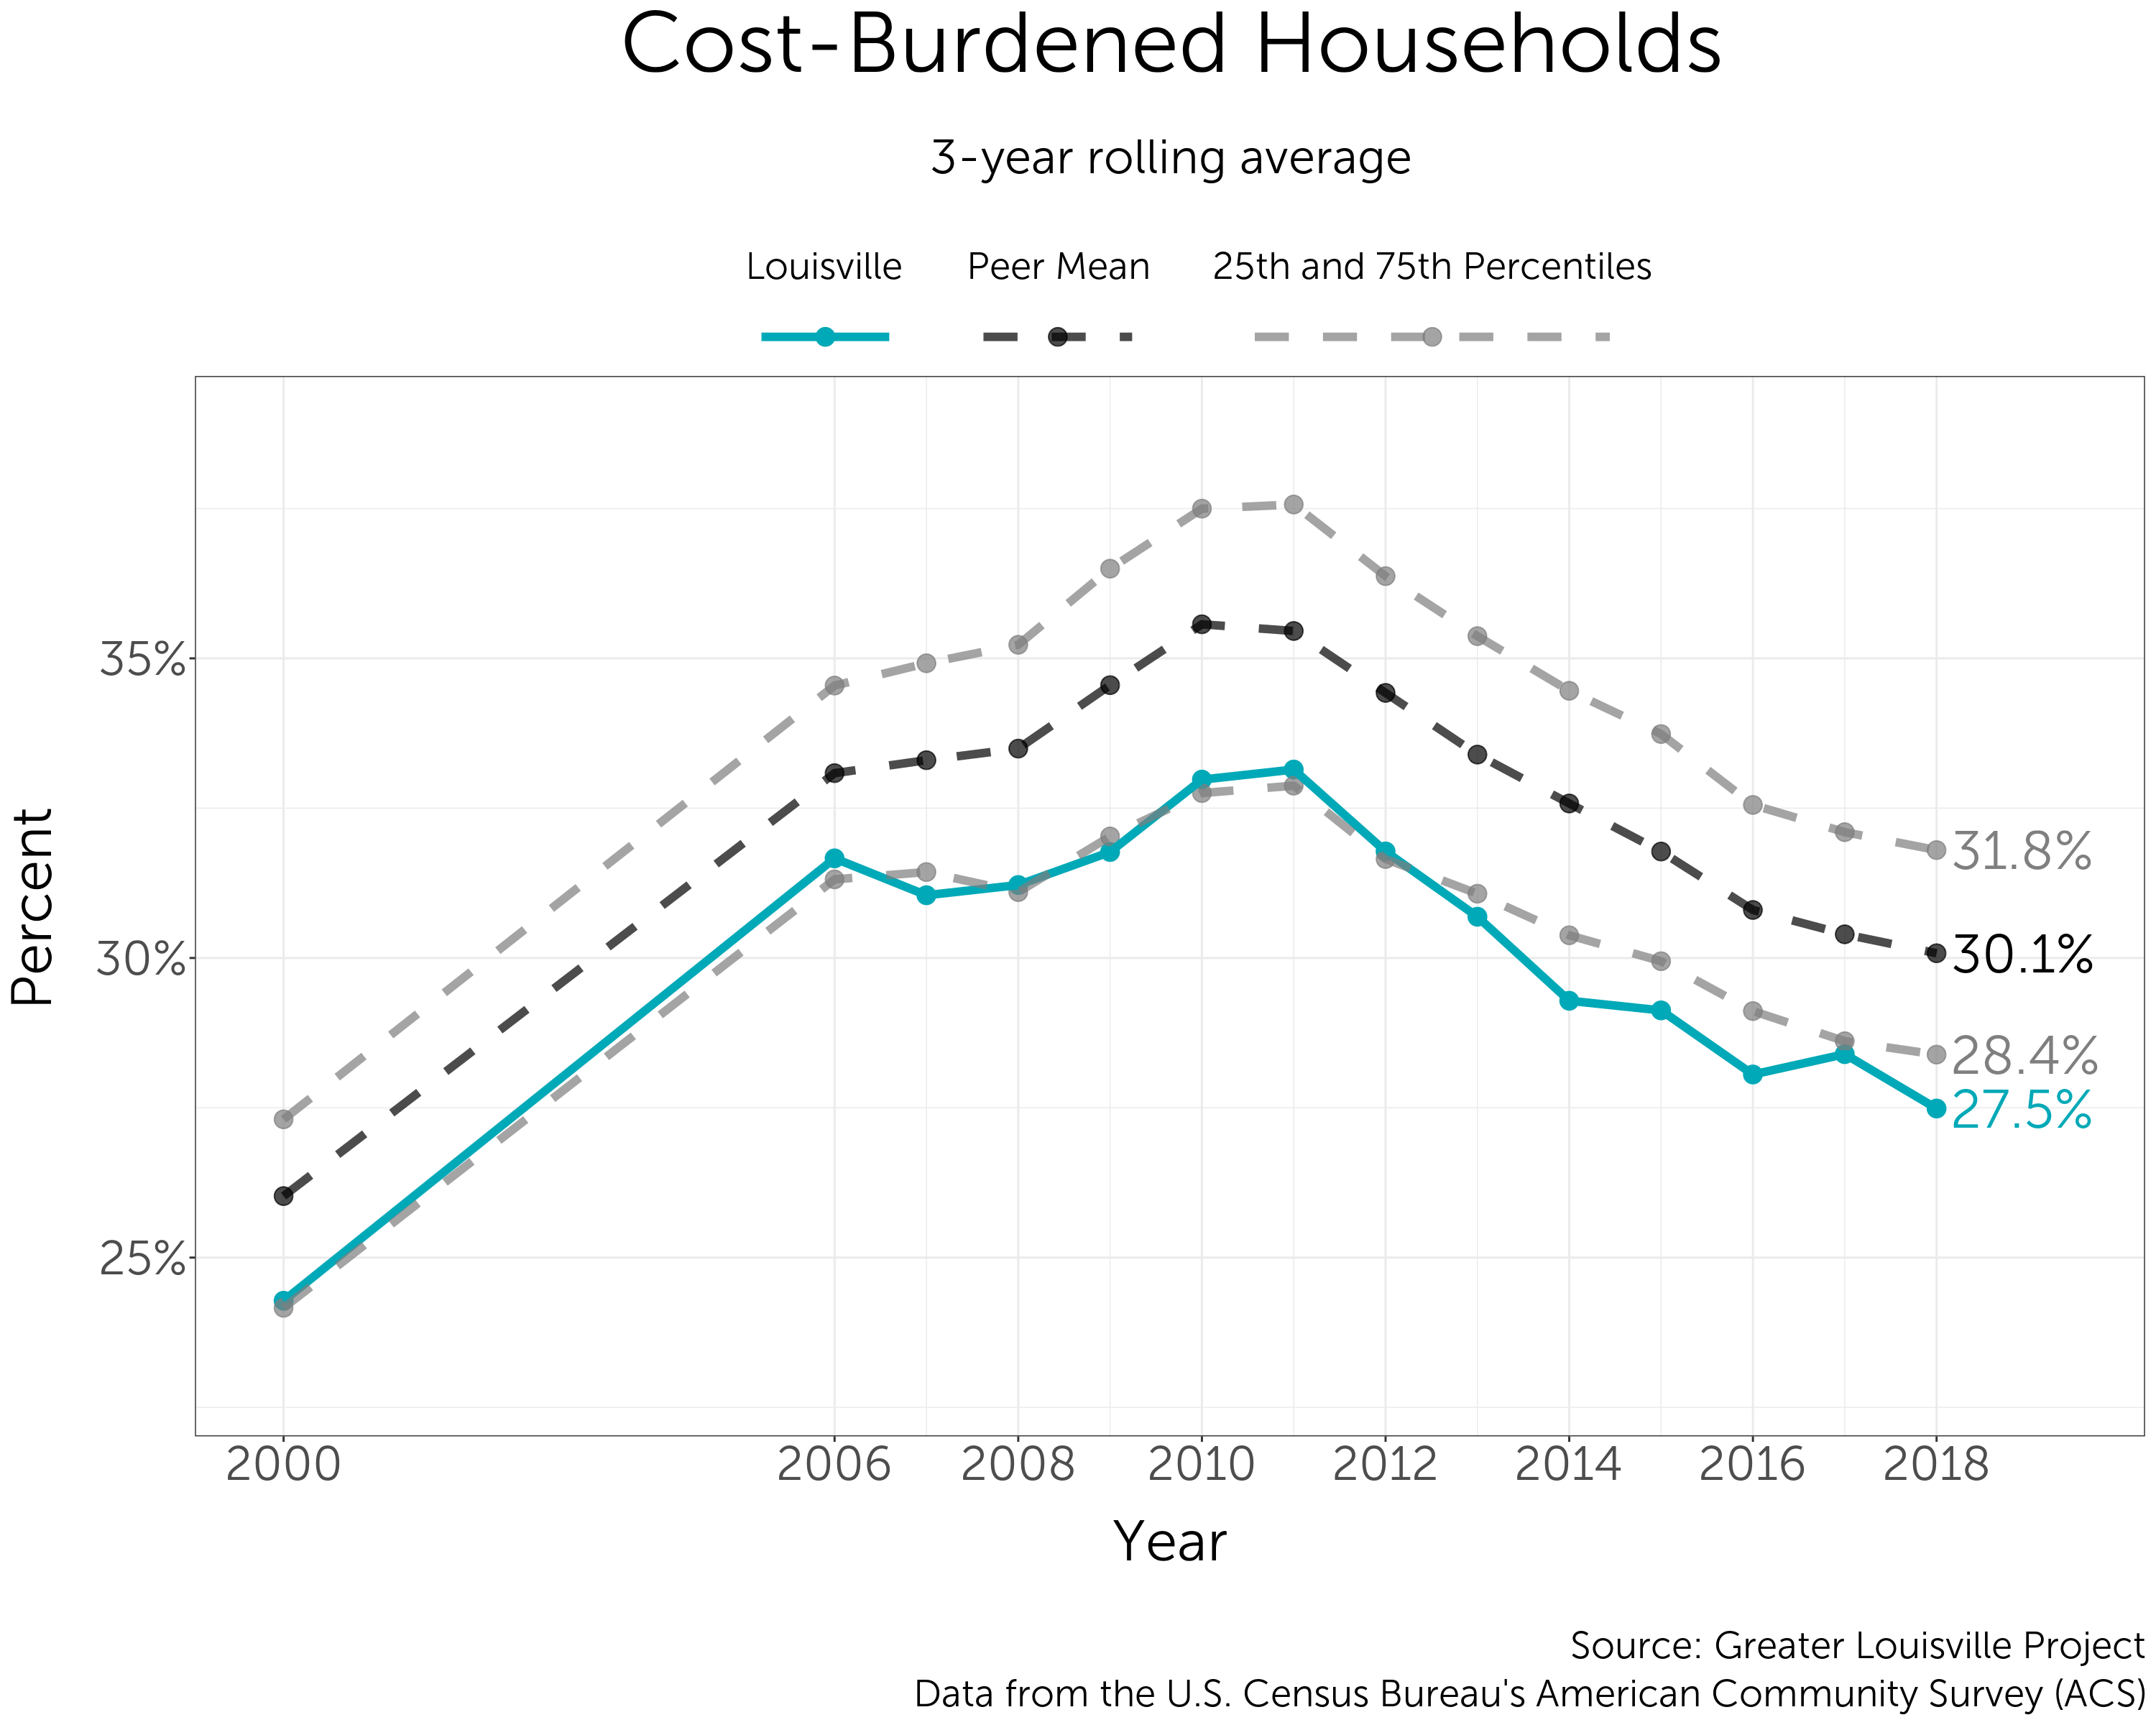
Over the last two decades, the percentage of cost-burdened households in Louisville and its peer cities has risen sharply and since fallen. Toward the end of the last decade, Louisville saw a decreasing percentage of cost-burdened households and rose to the top-performing quartile of its peers.
Best and Worst Peer Performers
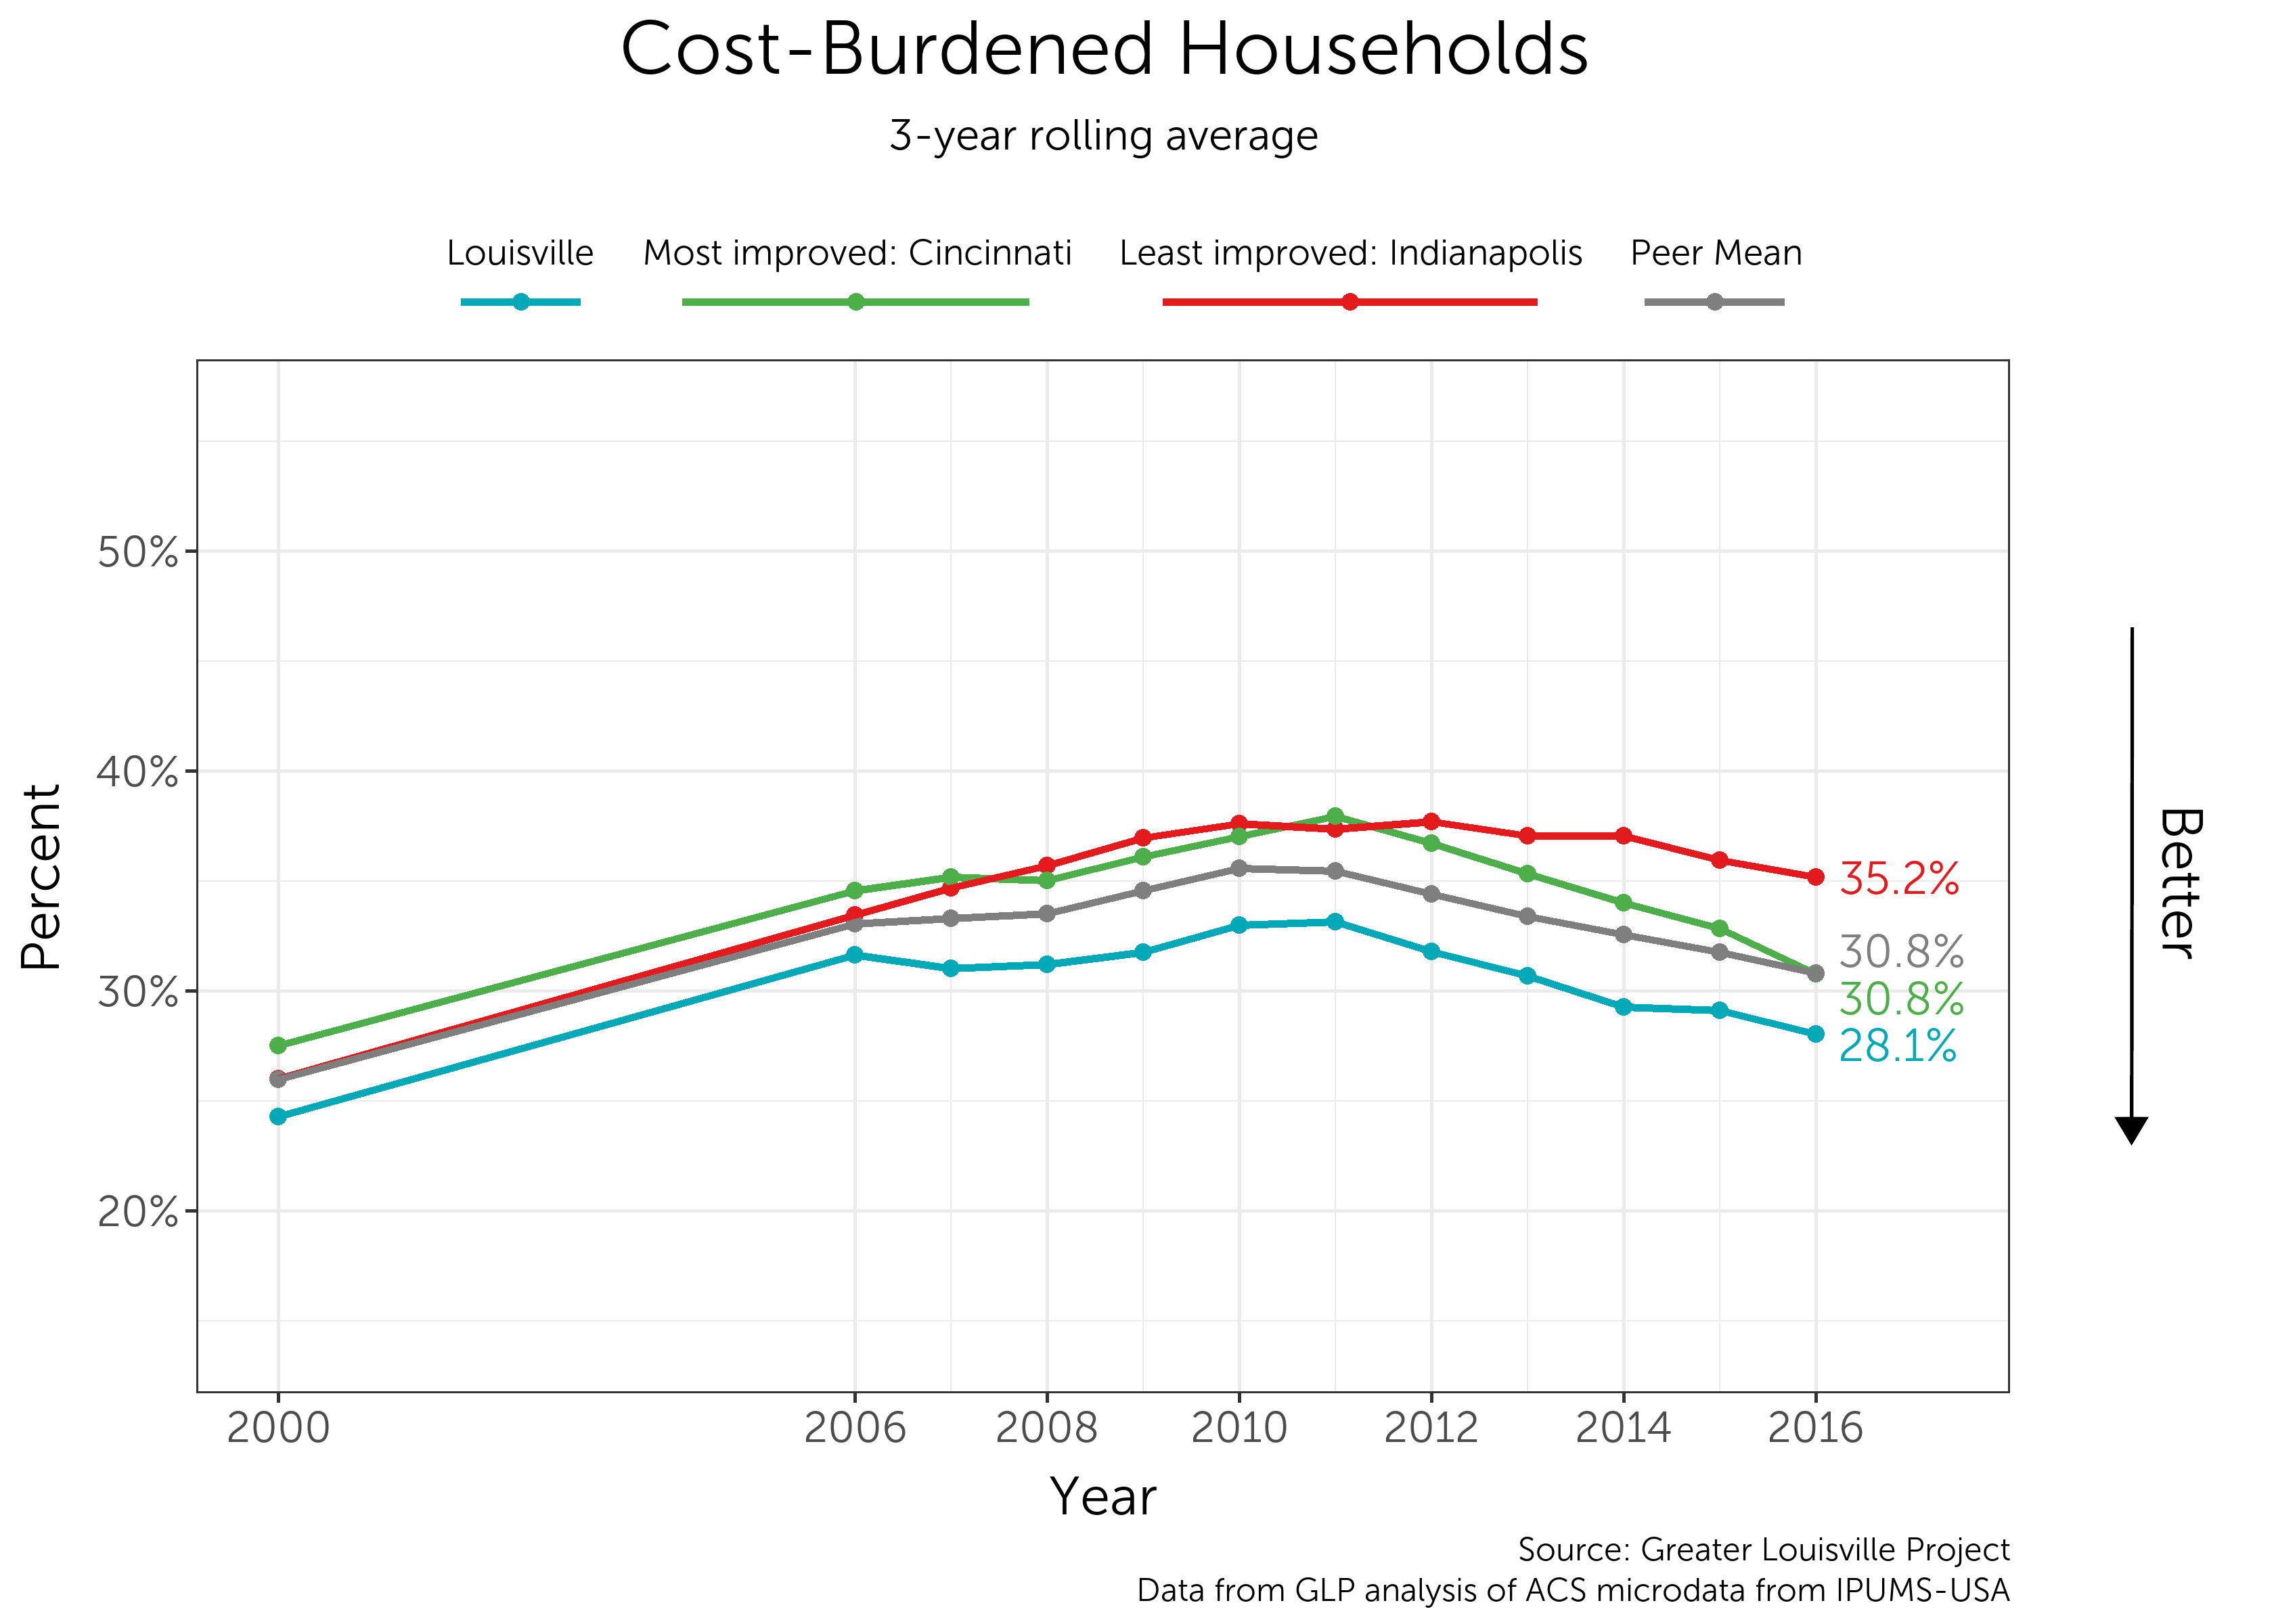
Indianapolis saw its percentage of cost-burdened households rise by more than 8 percentage points over the last two decades, making it the worst performer of the group. In contrast, Greenville’s cost-burdened household percentage only rose by about 1 percentage point over the same time period, making it the best performer. Louisville’s percentage has increased by a little more than 3 percentage points.
Differences by Sex
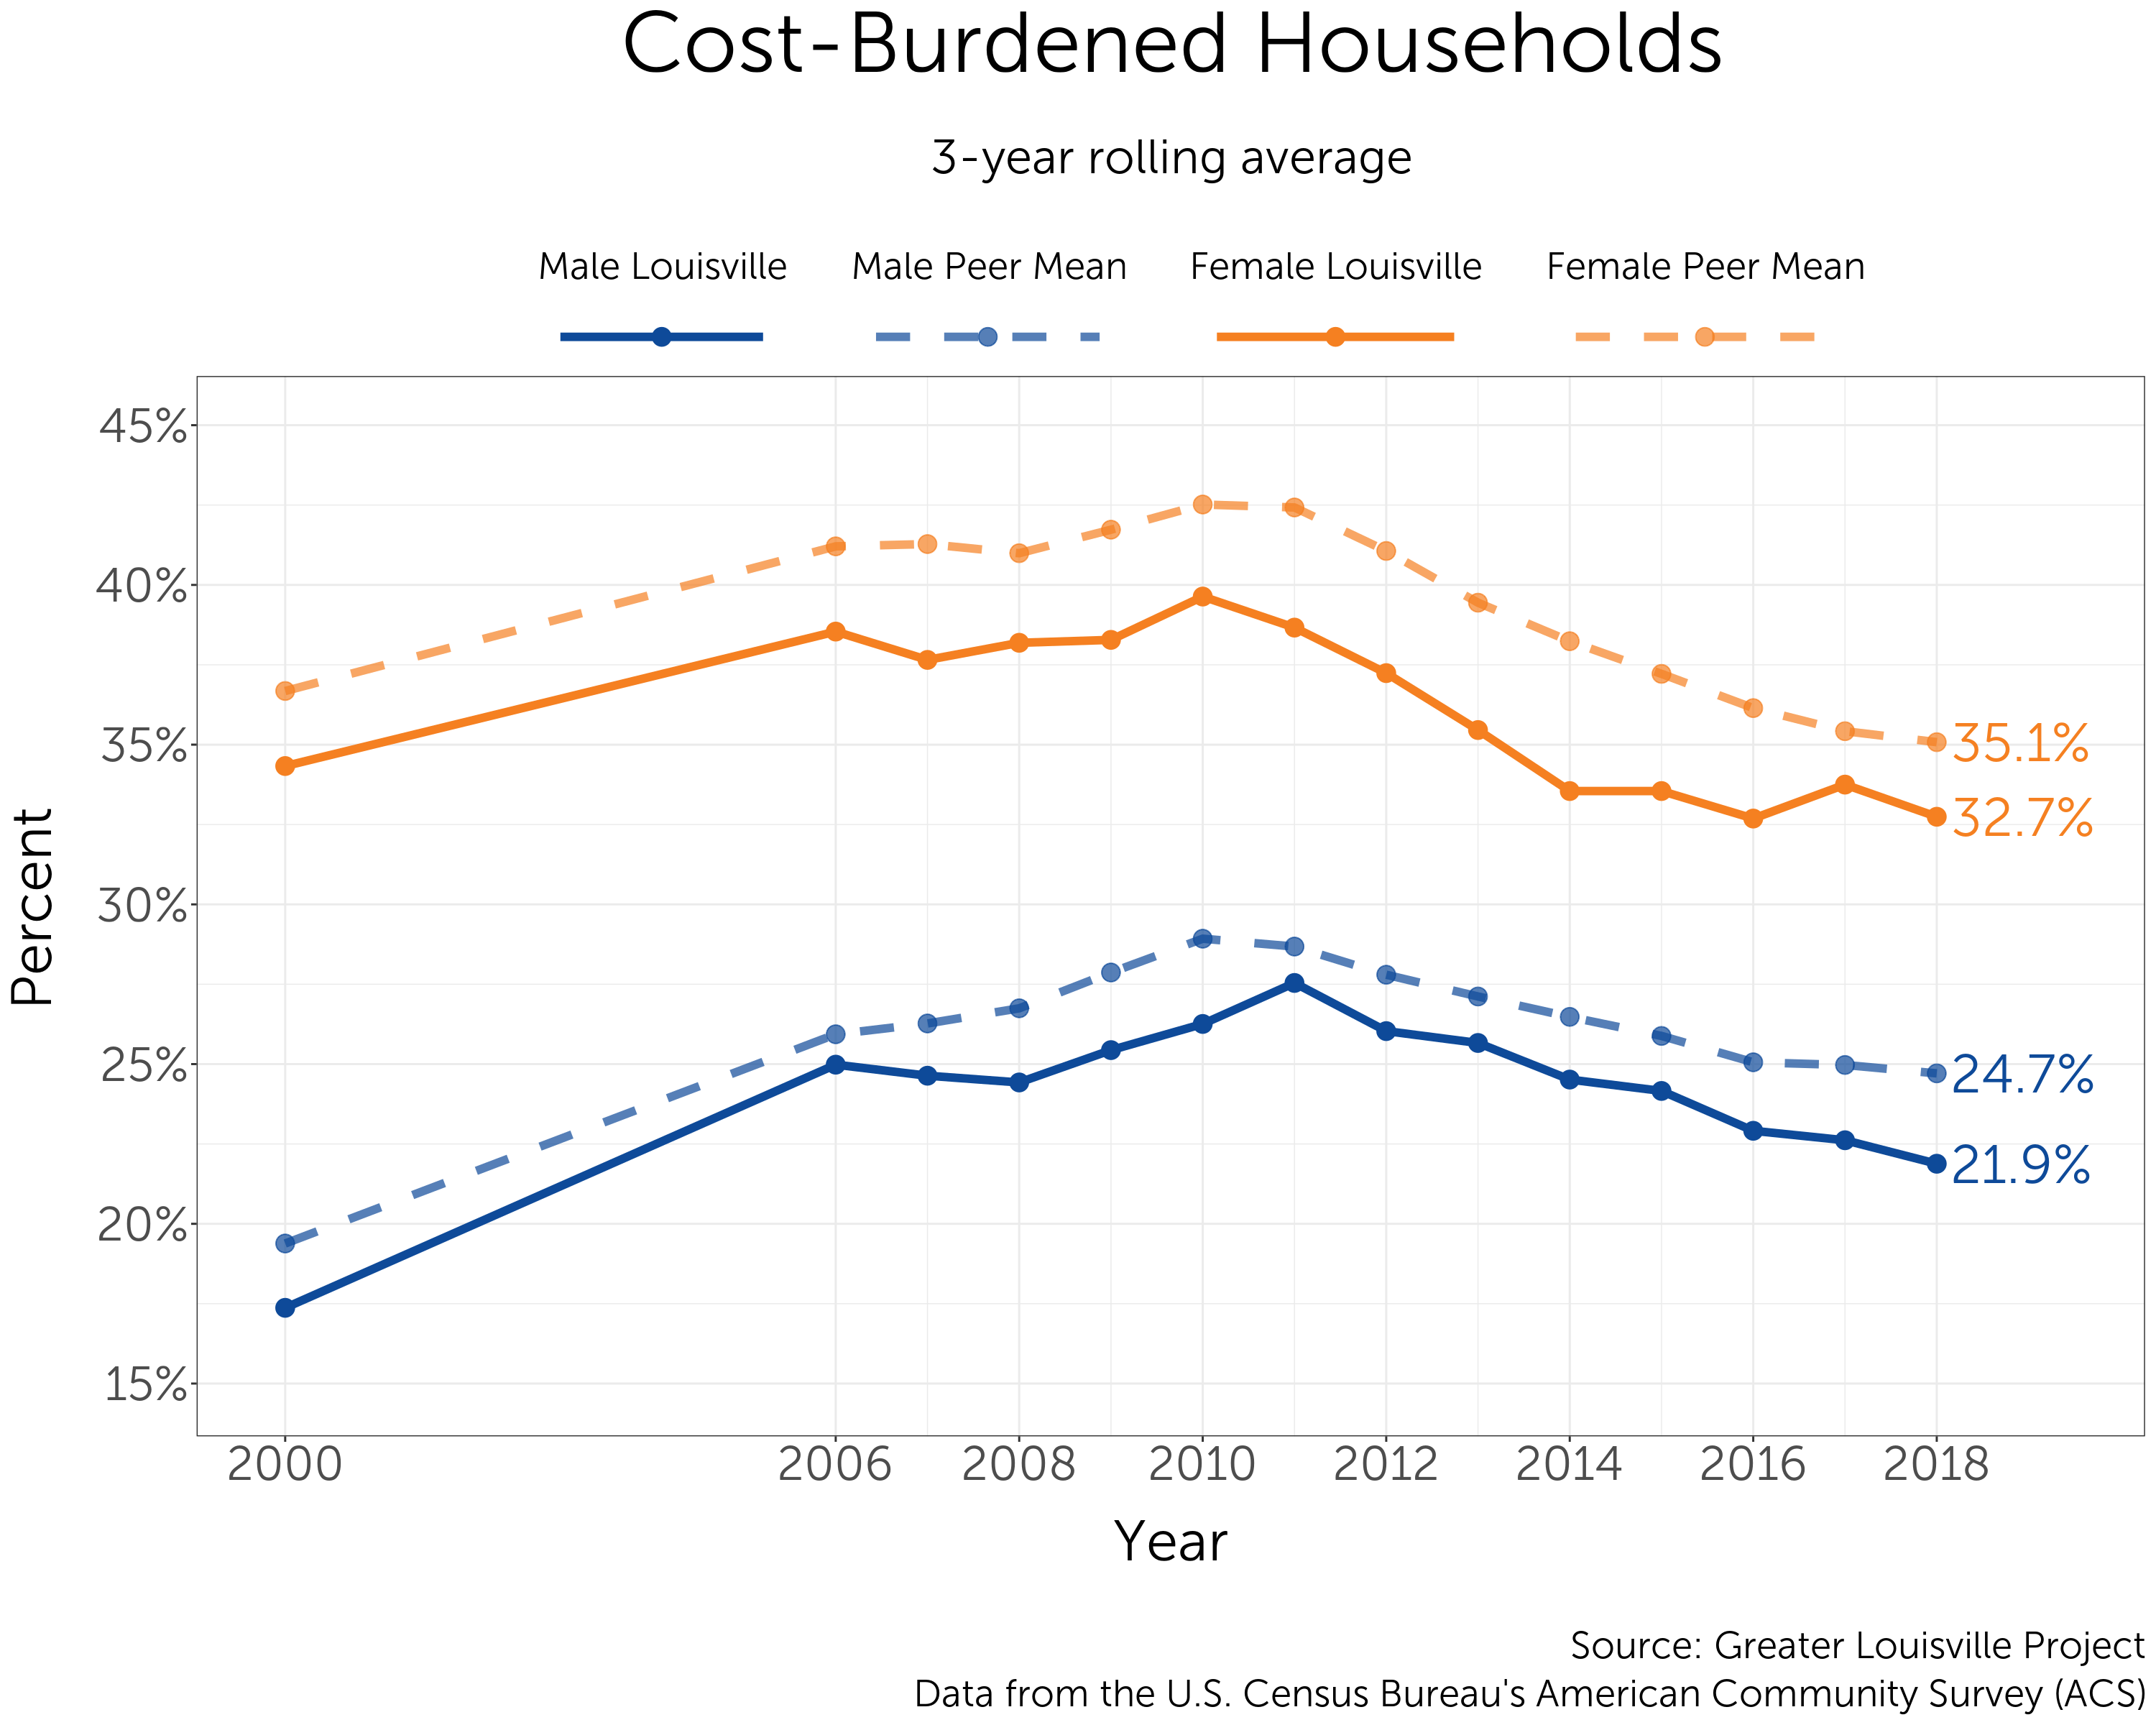
In Louisville and its peer cities, significantly more women than men live in cost-burdened households. However, for both men and women, the rate has been decreasing in recent years.
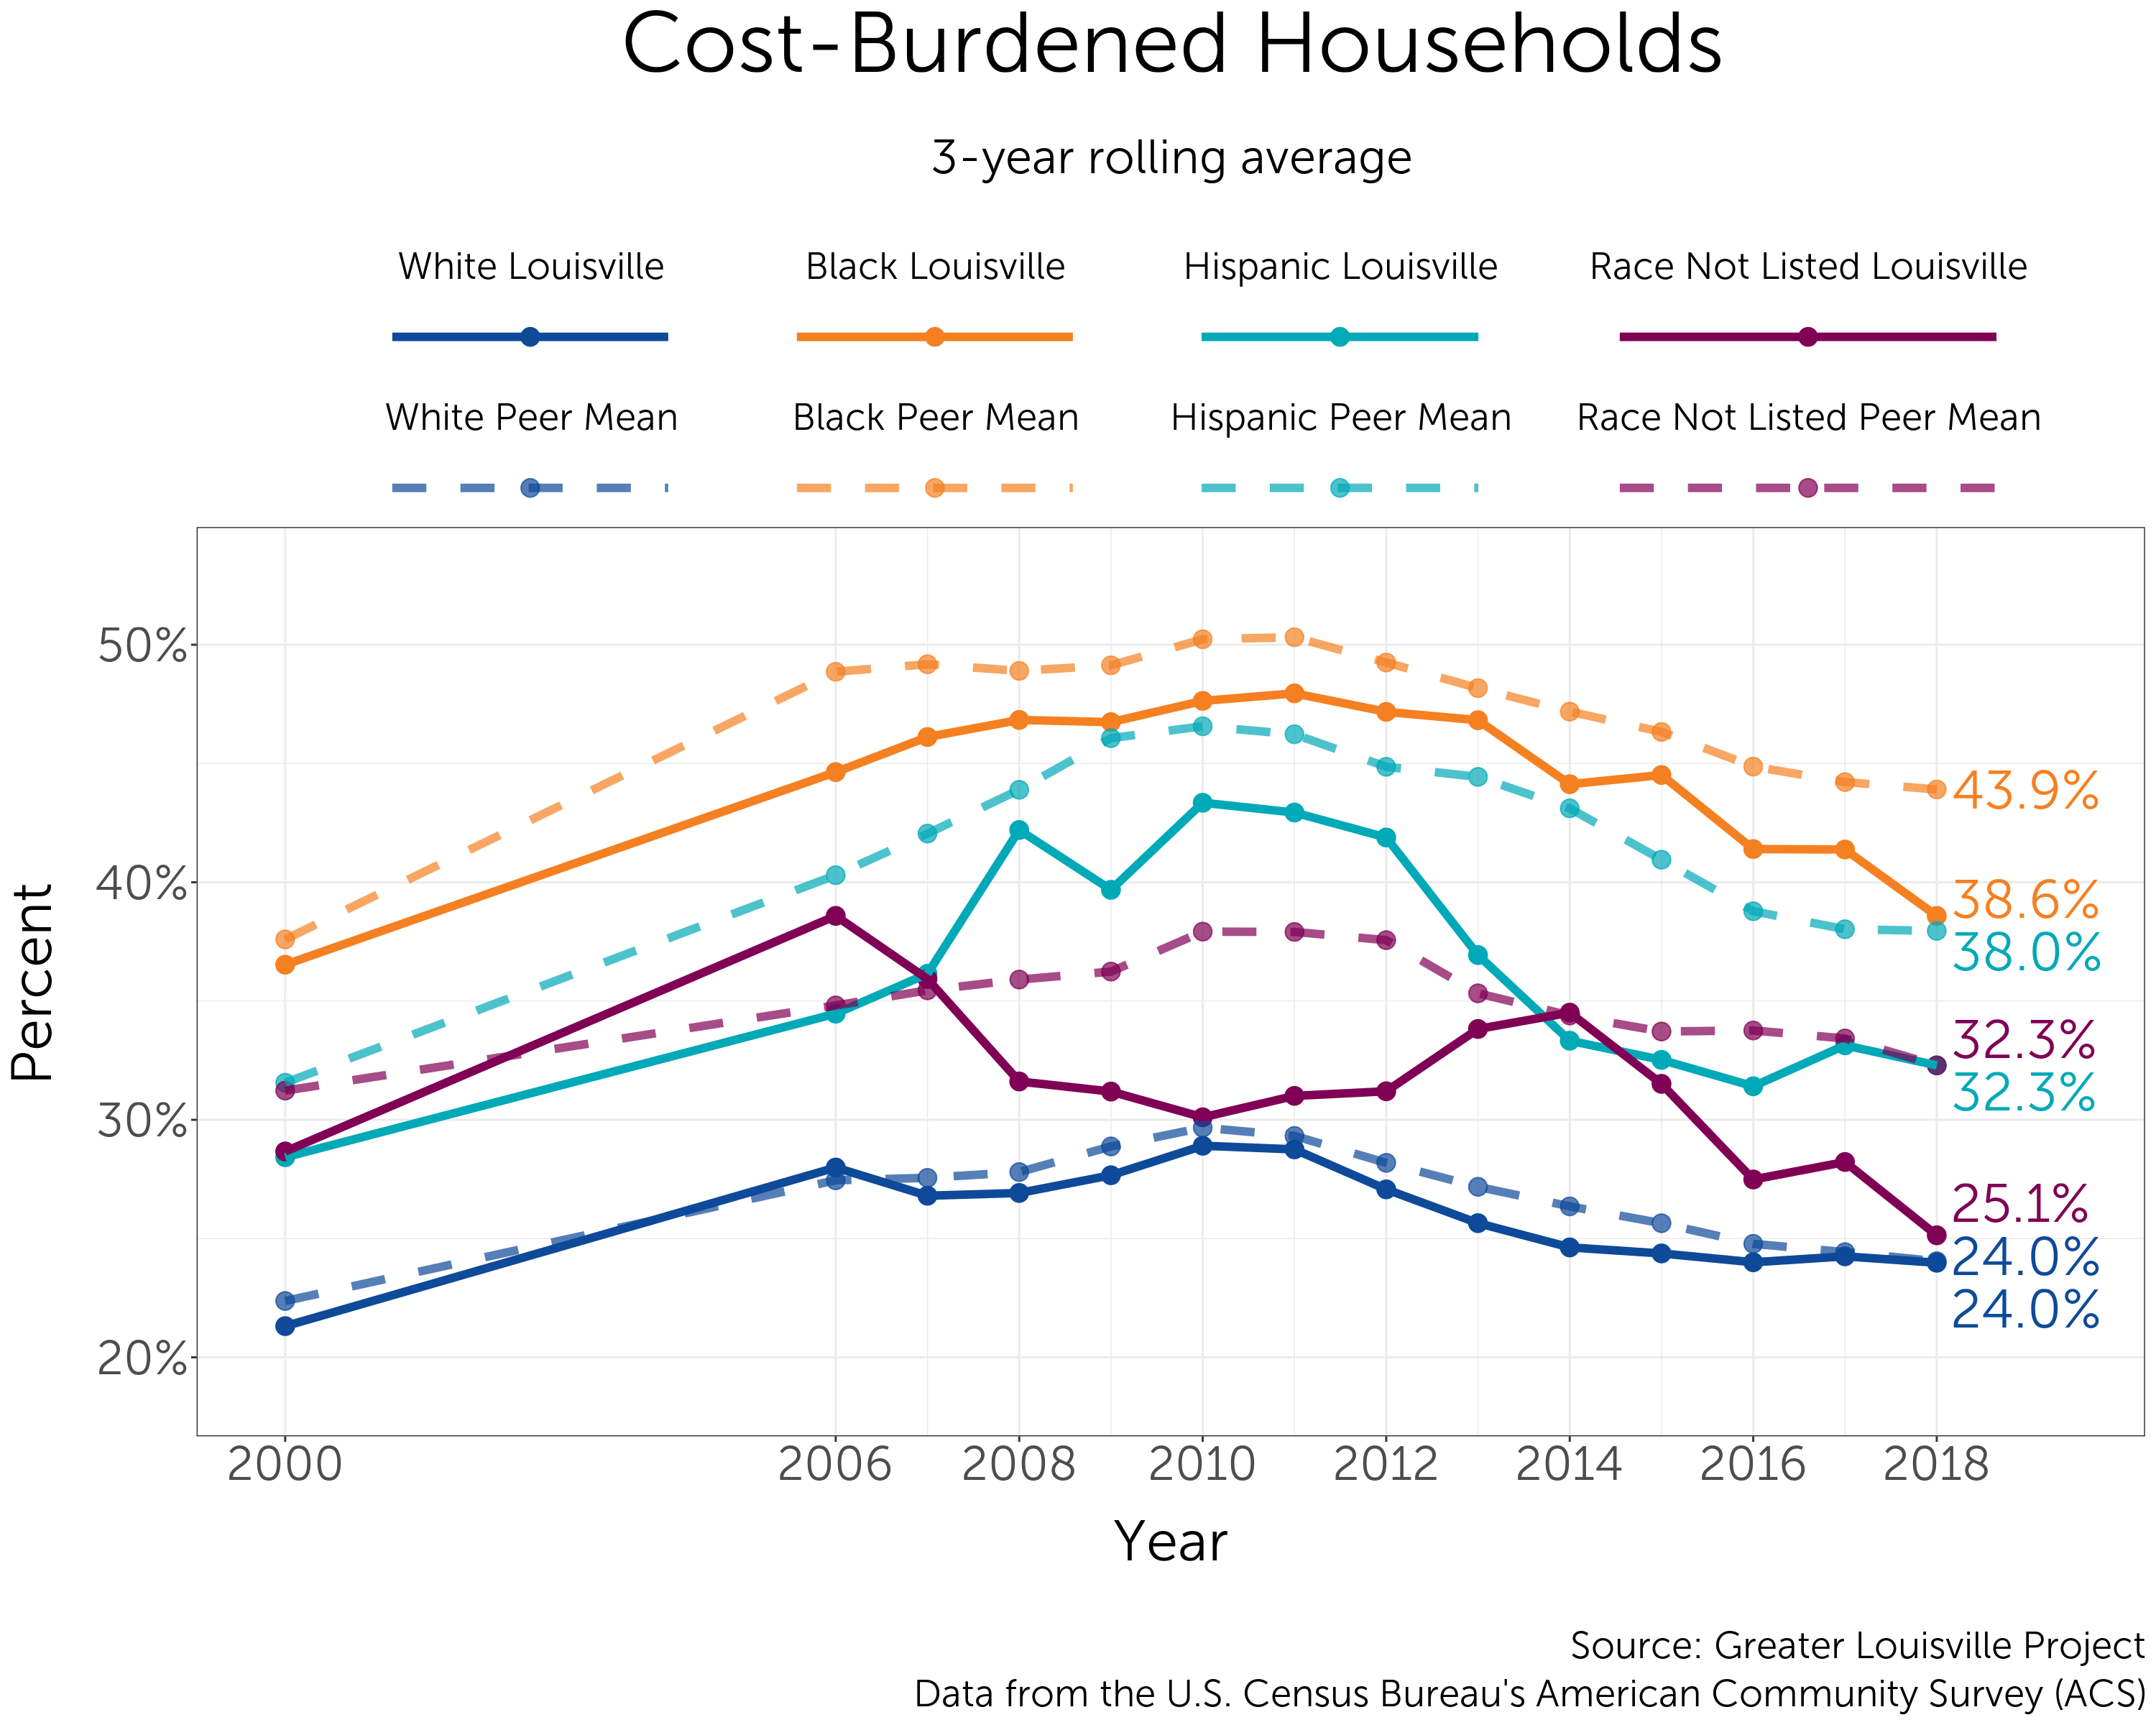
Differences by Race
In Louisville, nearly 39% of Black residents live in cost-burdened households. That’s higher than Hispanic residents (about 32%) and White residents (24%). The percentage of cost-burdened households among Black and Hispanic residents is even higher in Louisville’s peer cities.
Continue Exploring with Related Data
Housing Price Index
A house is the largest financial investment that most Americans will make in their lifetimes. Rising prices may keep individuals in rental properties rather than in homes that they own. Additionally, rising prices could displace residents or even lead to increased rates of homelessness.
Peer City Perspective
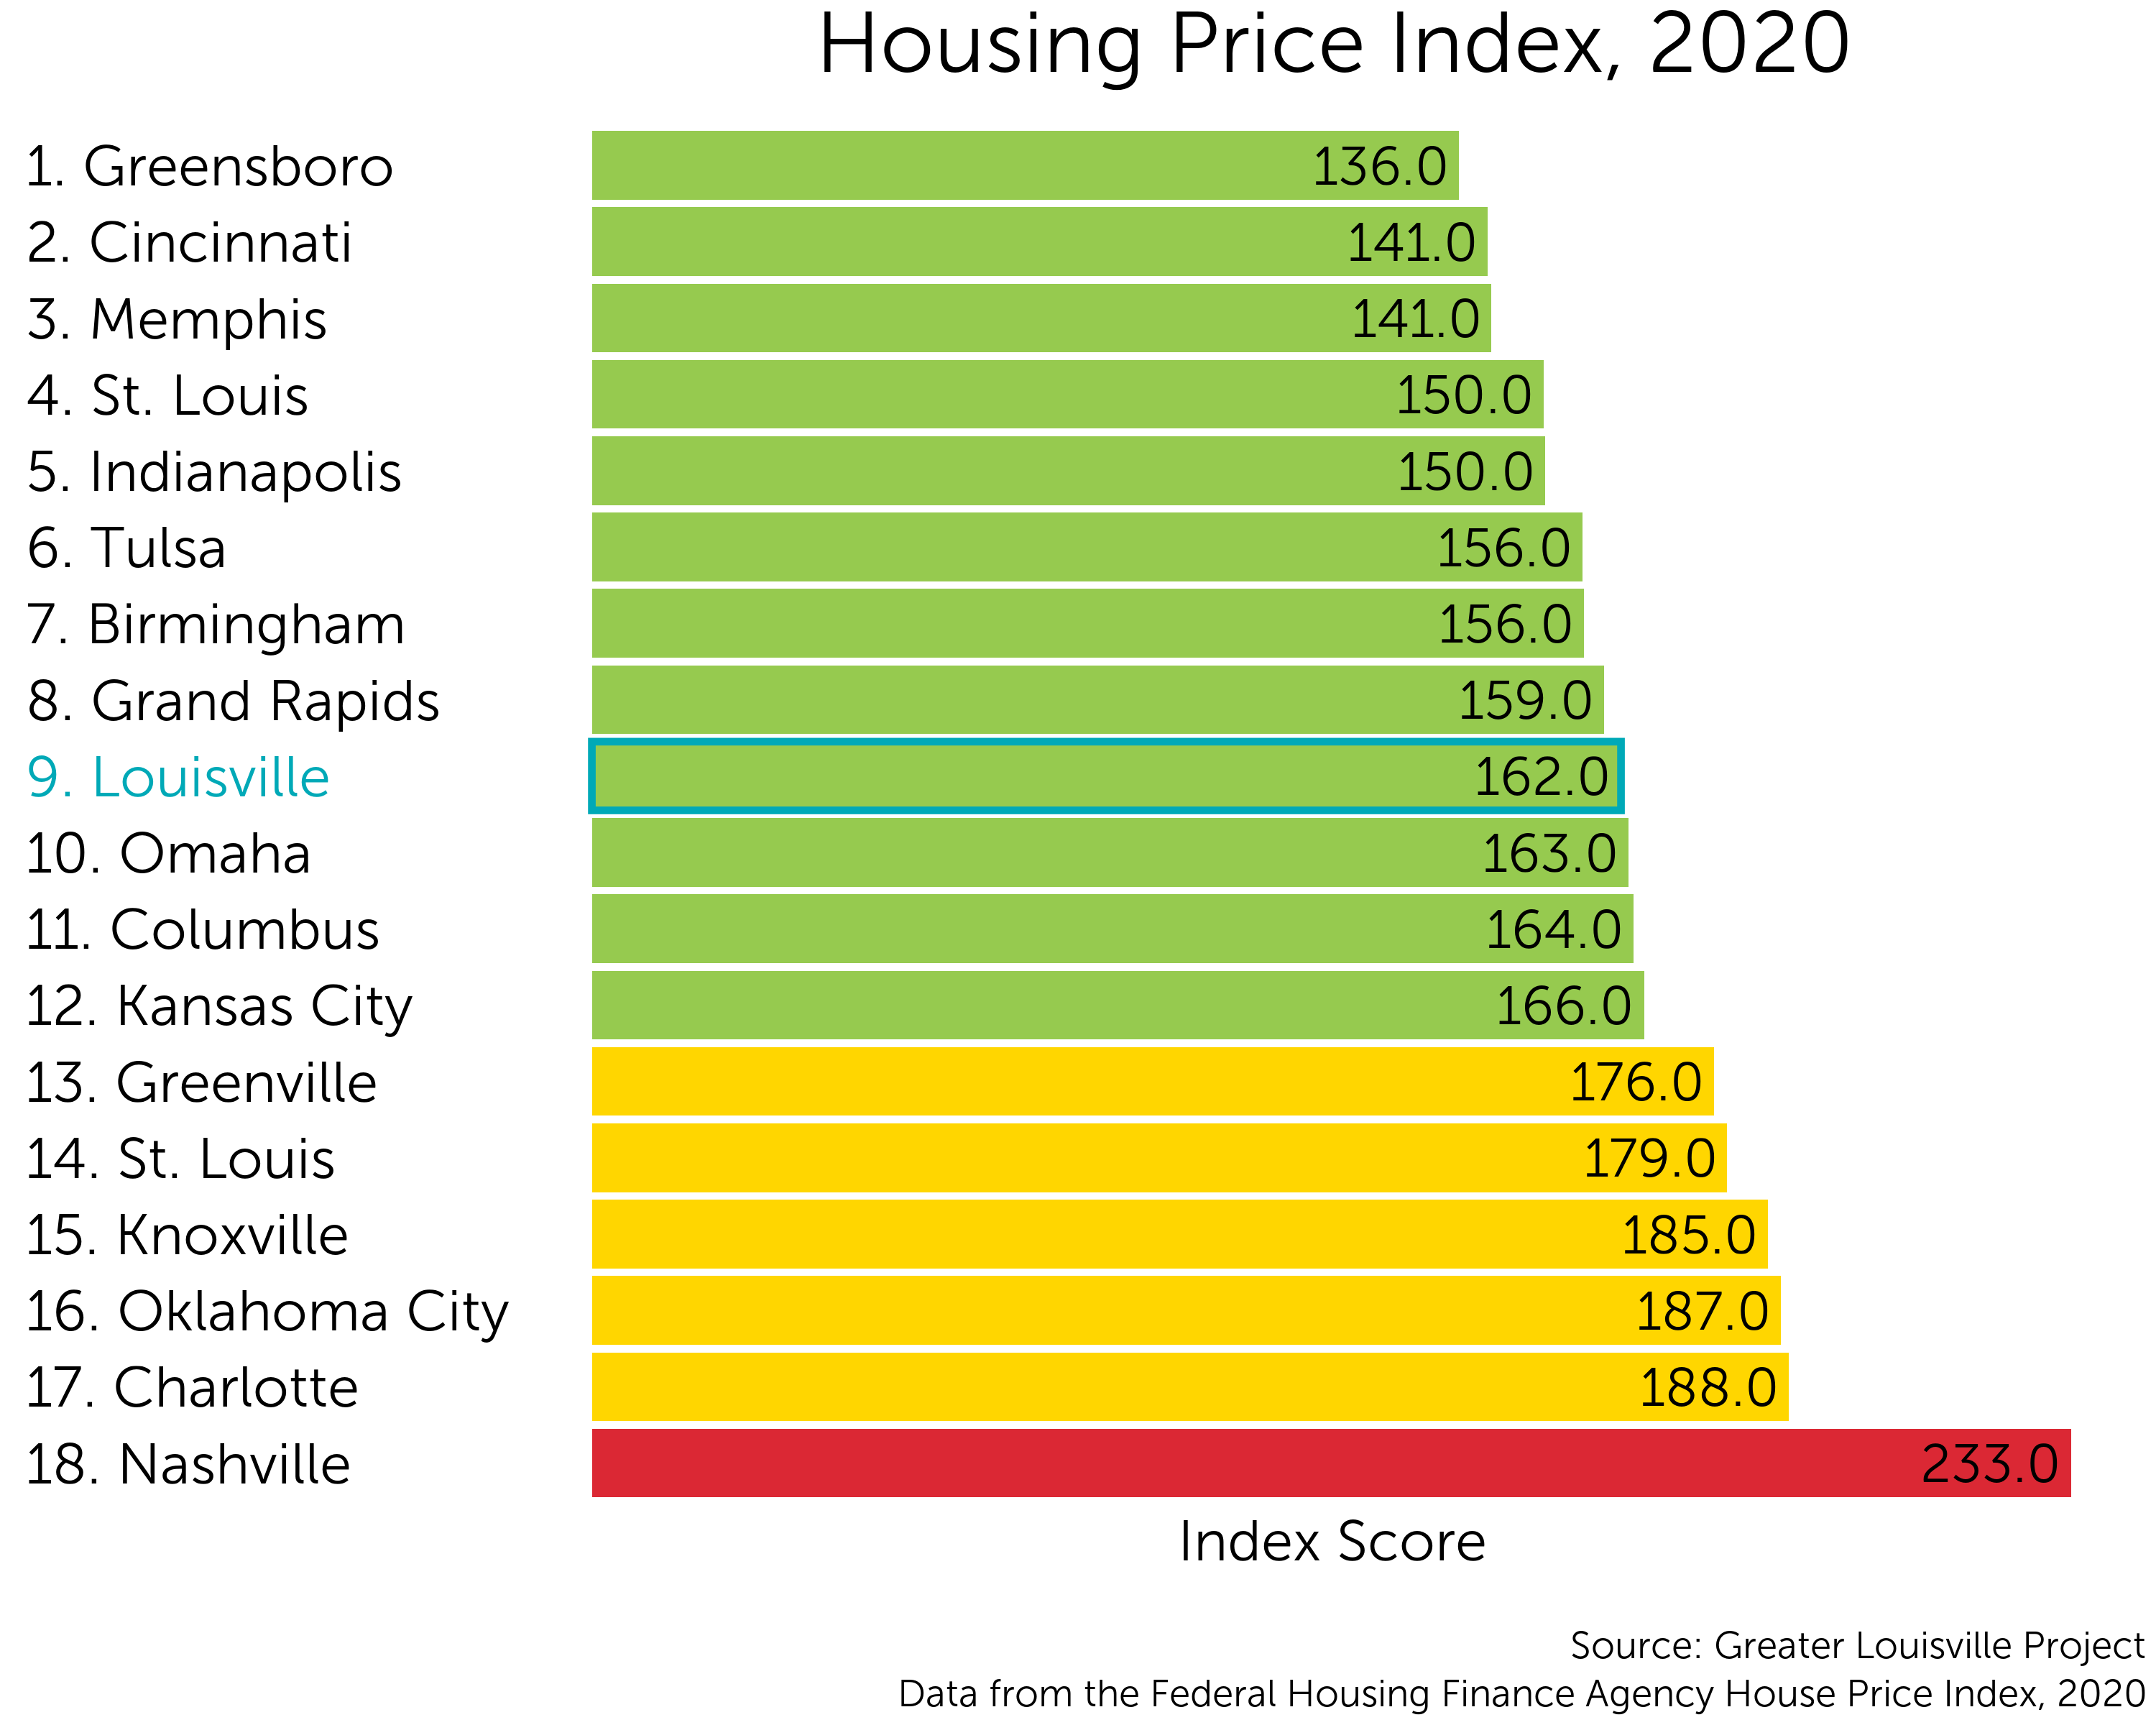
The housing price index, which is reported by the Federal Housing Finance Agency, measures average price changes in repeat sales or refinancing on the same properties. It serves as an accurate indicator of housing price trends in an area. Louisville currently ranks 9th among its peers with an index score of 162.
That puts it in the top tier of its peers according to a natural breaks algorithm. Cities in green are those that outperform their peers. Cities in yellow represent the middle cluster, and those in red lag behind their peers on this indicator.
Trends over Time
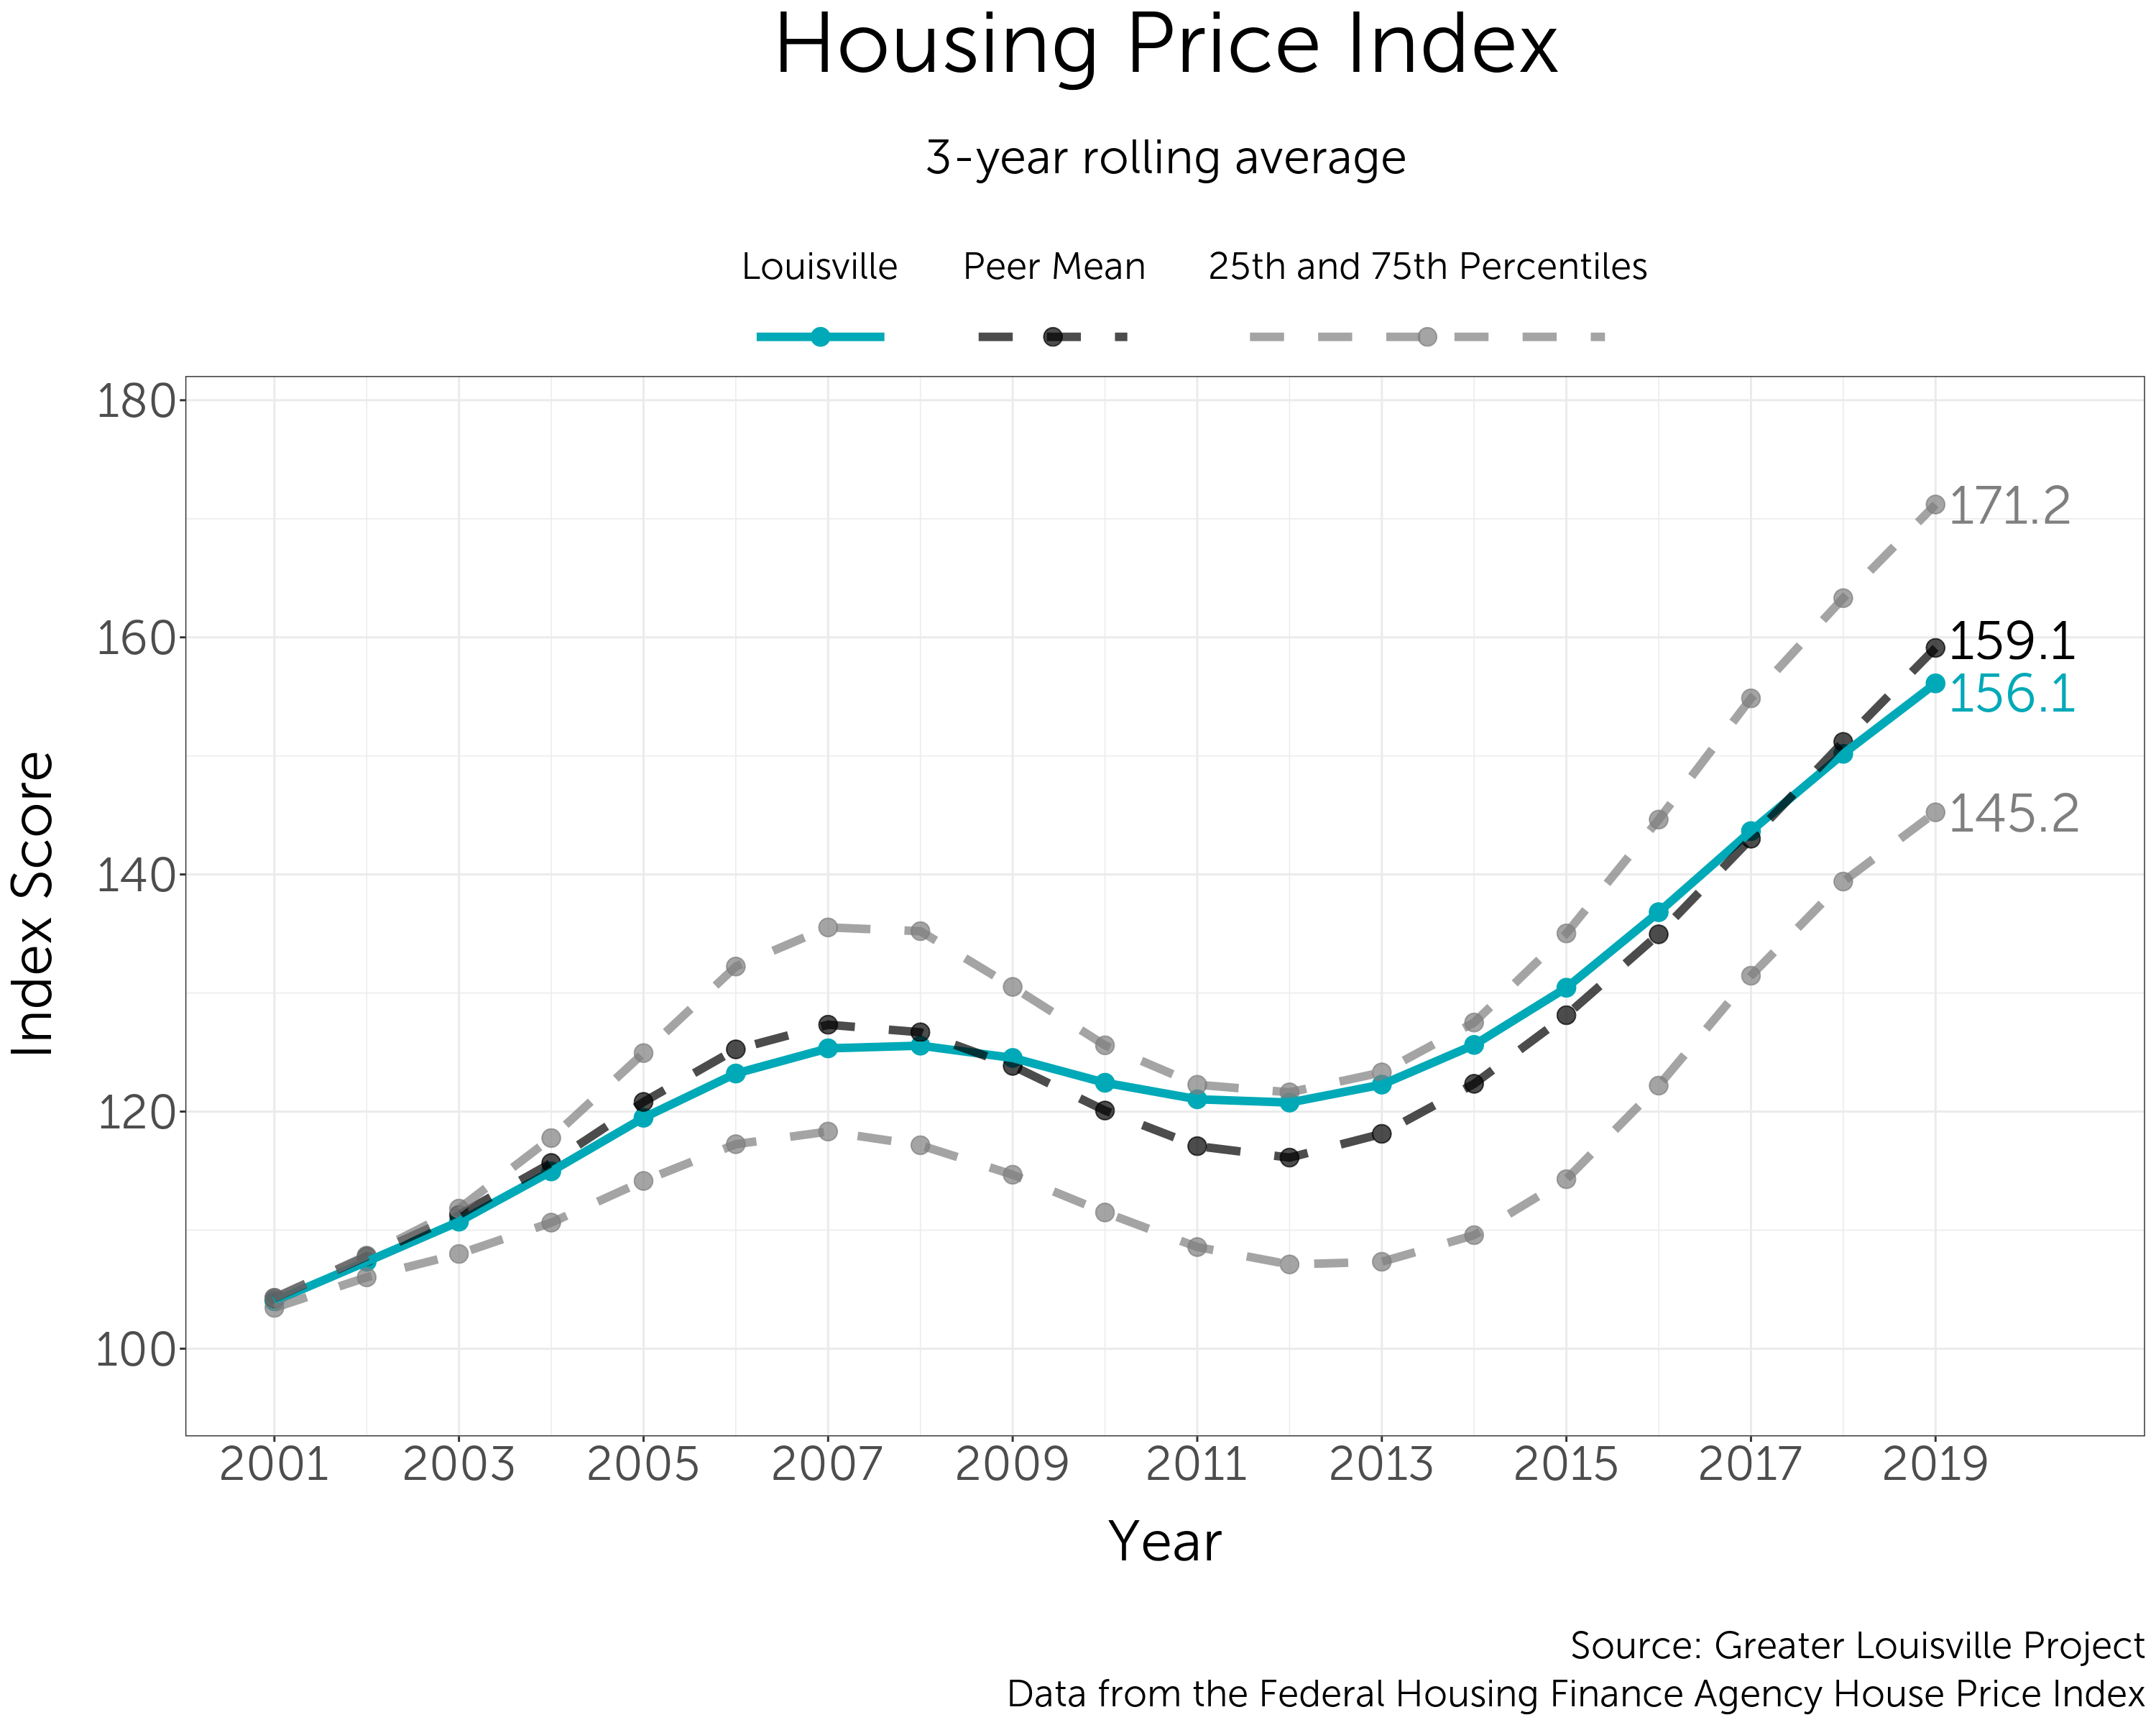
Housing Price Index values have been rising steadily in Louisville and its peer cities over the past decade. In recent years, Louisville’s index value has come in below that of its peer city average.
Best and Worst Peer Performers
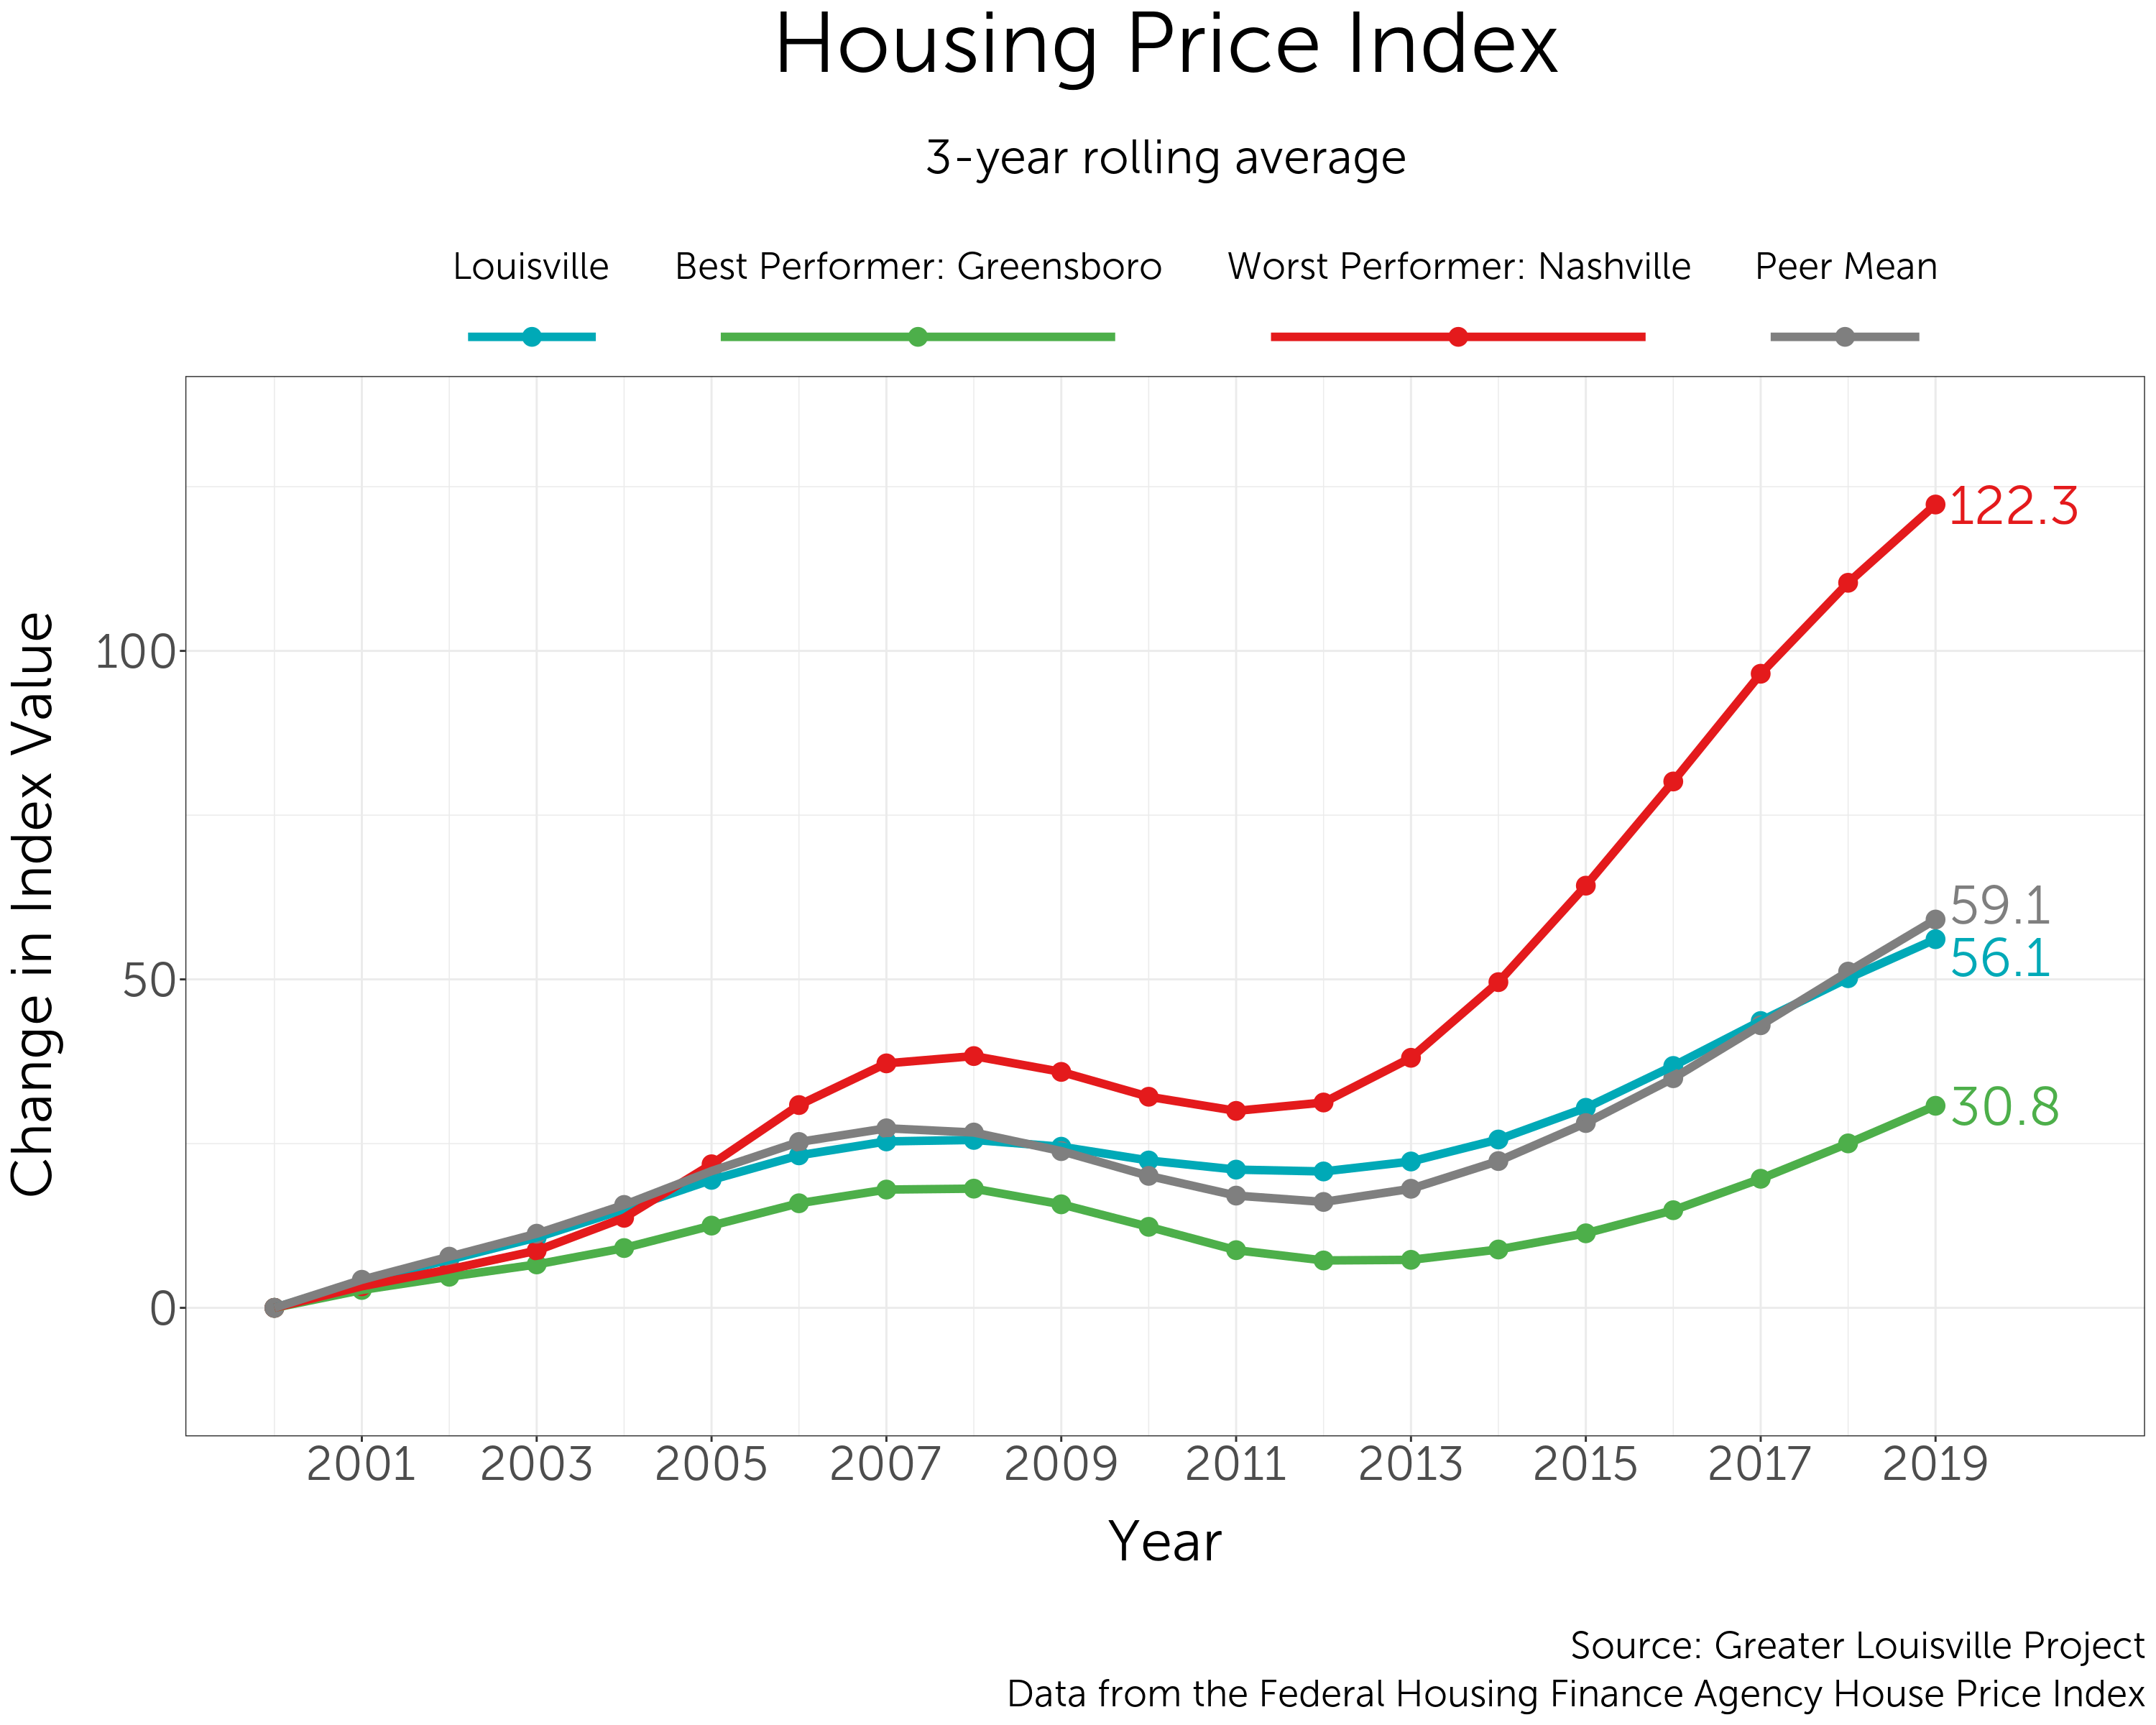
Over the last two decades, Nashville has seen its index score rise the most — more than 120 points — making it the worst performer of the group. Greensboro’s score has risen the least — about 31 points — making it the best performer. Louisville has performed slightly better than its peers, on average.
Net Migration Flow
A positive influx of new residents to a community indicates that a city is thriving enough to attract new residents. Attracting national talent to Louisville will strengthen our local economy. Additionally, growing our regional and cultural diversity with new residents will enrich the vibrancy of our communities.
Peer City Perspective
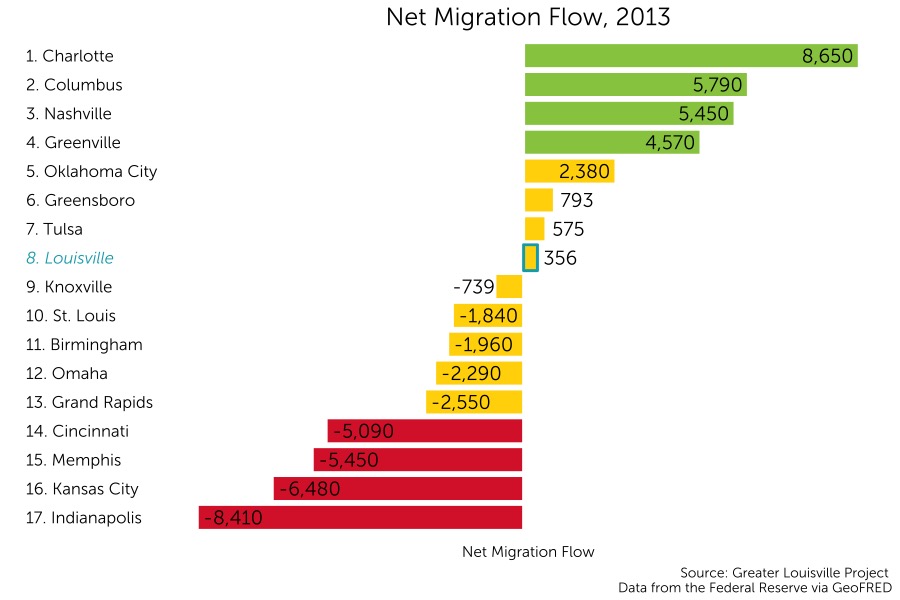
Louisville currently ranks 8th among its peers in net migration flow with a net migration flow of 356 residents in 2015. In addition to Louisville, only seven of its peer cities had a positive net migration rate in 2013. Net migration flow is established through ACS survey data, which tracks whether respondents have lived in the same residence as one year ago and, if not, the location of their previous residence.
Louisville is in the middle tier of its peer group according to a natural breaks algorithm. Cities in green are those that outperform their peers, cities in yellow represent the middle cluster, and those in red are a group that lags behind its peers on this indicator.
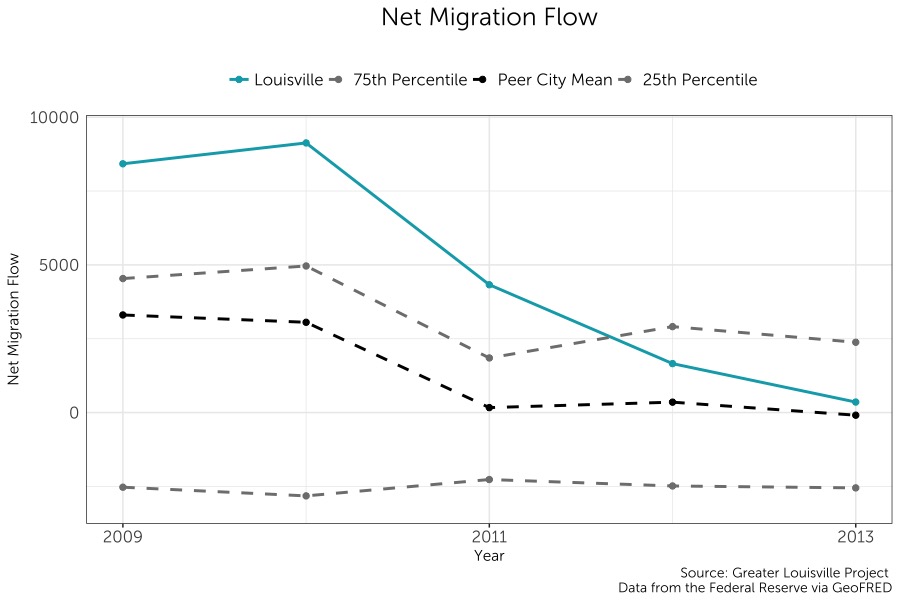
Trends Over Time
Louisville’s net migration flow has been decreasing since it peaked in 2010 at approximately 9,000 new residents. Despite the steady decline since 2010, Louisville’s net migration flow remains positive and greater than its peer city average. Since 2011, Louisville’s peer city average has been approximately zero.
Multidimensional Poverty
The effects of poverty are not just on the wallet, but in every barrier to health and wellbeing. The multidimensional poverty index reflects the fact that individuals experience poverty in multiple forms: low income, poorer health, unemployment, low education, and living in a poor neighborhood. These factors are not additive–each experienced factor multiplies the barriers to success for an individual in poverty. In order to address the complex issue of poverty, efforts to effect positive change must be coherent with the notion that poverty is caused by multiple, confounding factors.
Peer City Perspective
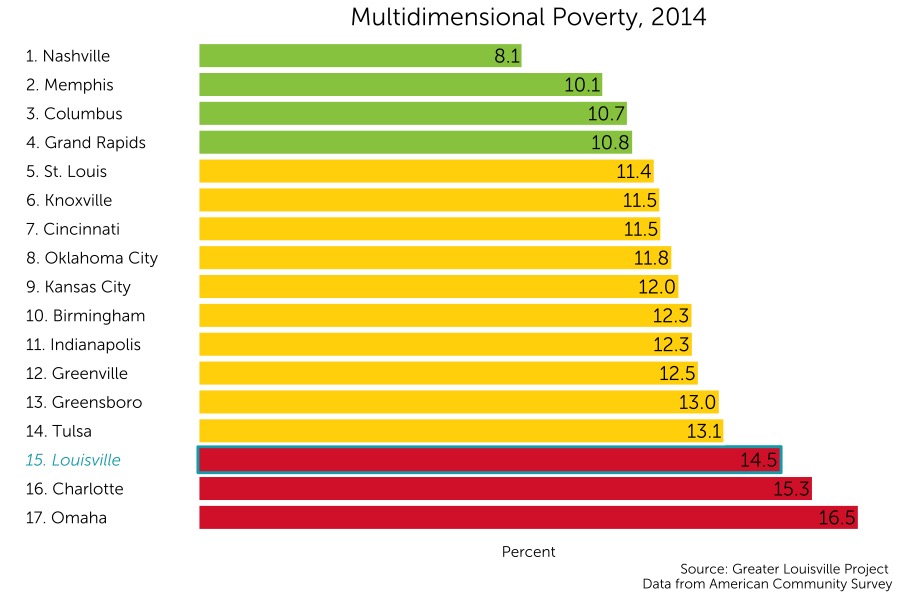
Louisville currently ranks 15th among its peers in rates of multidimensional poverty with 14.5% of residents living in multidimensional poverty. The multidimensional poverty index evaluates poverty through four dimensions: low income (150% of the poverty line), unemployment, lack of health insurance, and lack of a high school degree. A neighborhood is determined to be in multidimensional poverty if its average z-score across all four factors is greater than 1.
On this metric, Louisville ranks among the bottom tier of its peers according to a natural breaks algorithm. Cities in green are those that outperform their peers, cities in yellow represent the middle cluster, and those in red are a group that lags behind its peers on this indicator.
Where is multidimensional poverty concentrated?
Levels of multidimensional poverty vary greatly across the city. The neighborhoods with the highest level of multidimensional poverty are Russell and Portland. One of the tracts in the Portland neighborhood also has a very high level of multidimensional poverty, though it is offset by other tracts with lower levels of multidimensional poverty. The neighborhoods with the least multidimensional poverty are Floyd’s Fork, Northeast Jefferson, and the Highlands.
Scroll over the map to see values for each census tract. Zoom in to see street names that form the boundaries of each tract.
Continue Exploring with Related Data
Income Inequality
Growing income inequality is the result of educational disparities, stagnant wage growth in middle and lower class jobs, and a higher emphasis on creating a skilled workforce. Economists are divided on whether the implications of income inequality are positive or negative. Income inequality is the ratio of the average income of the top 20% of the population to the average income of the bottom 20% of the population.
Peer City Perspective
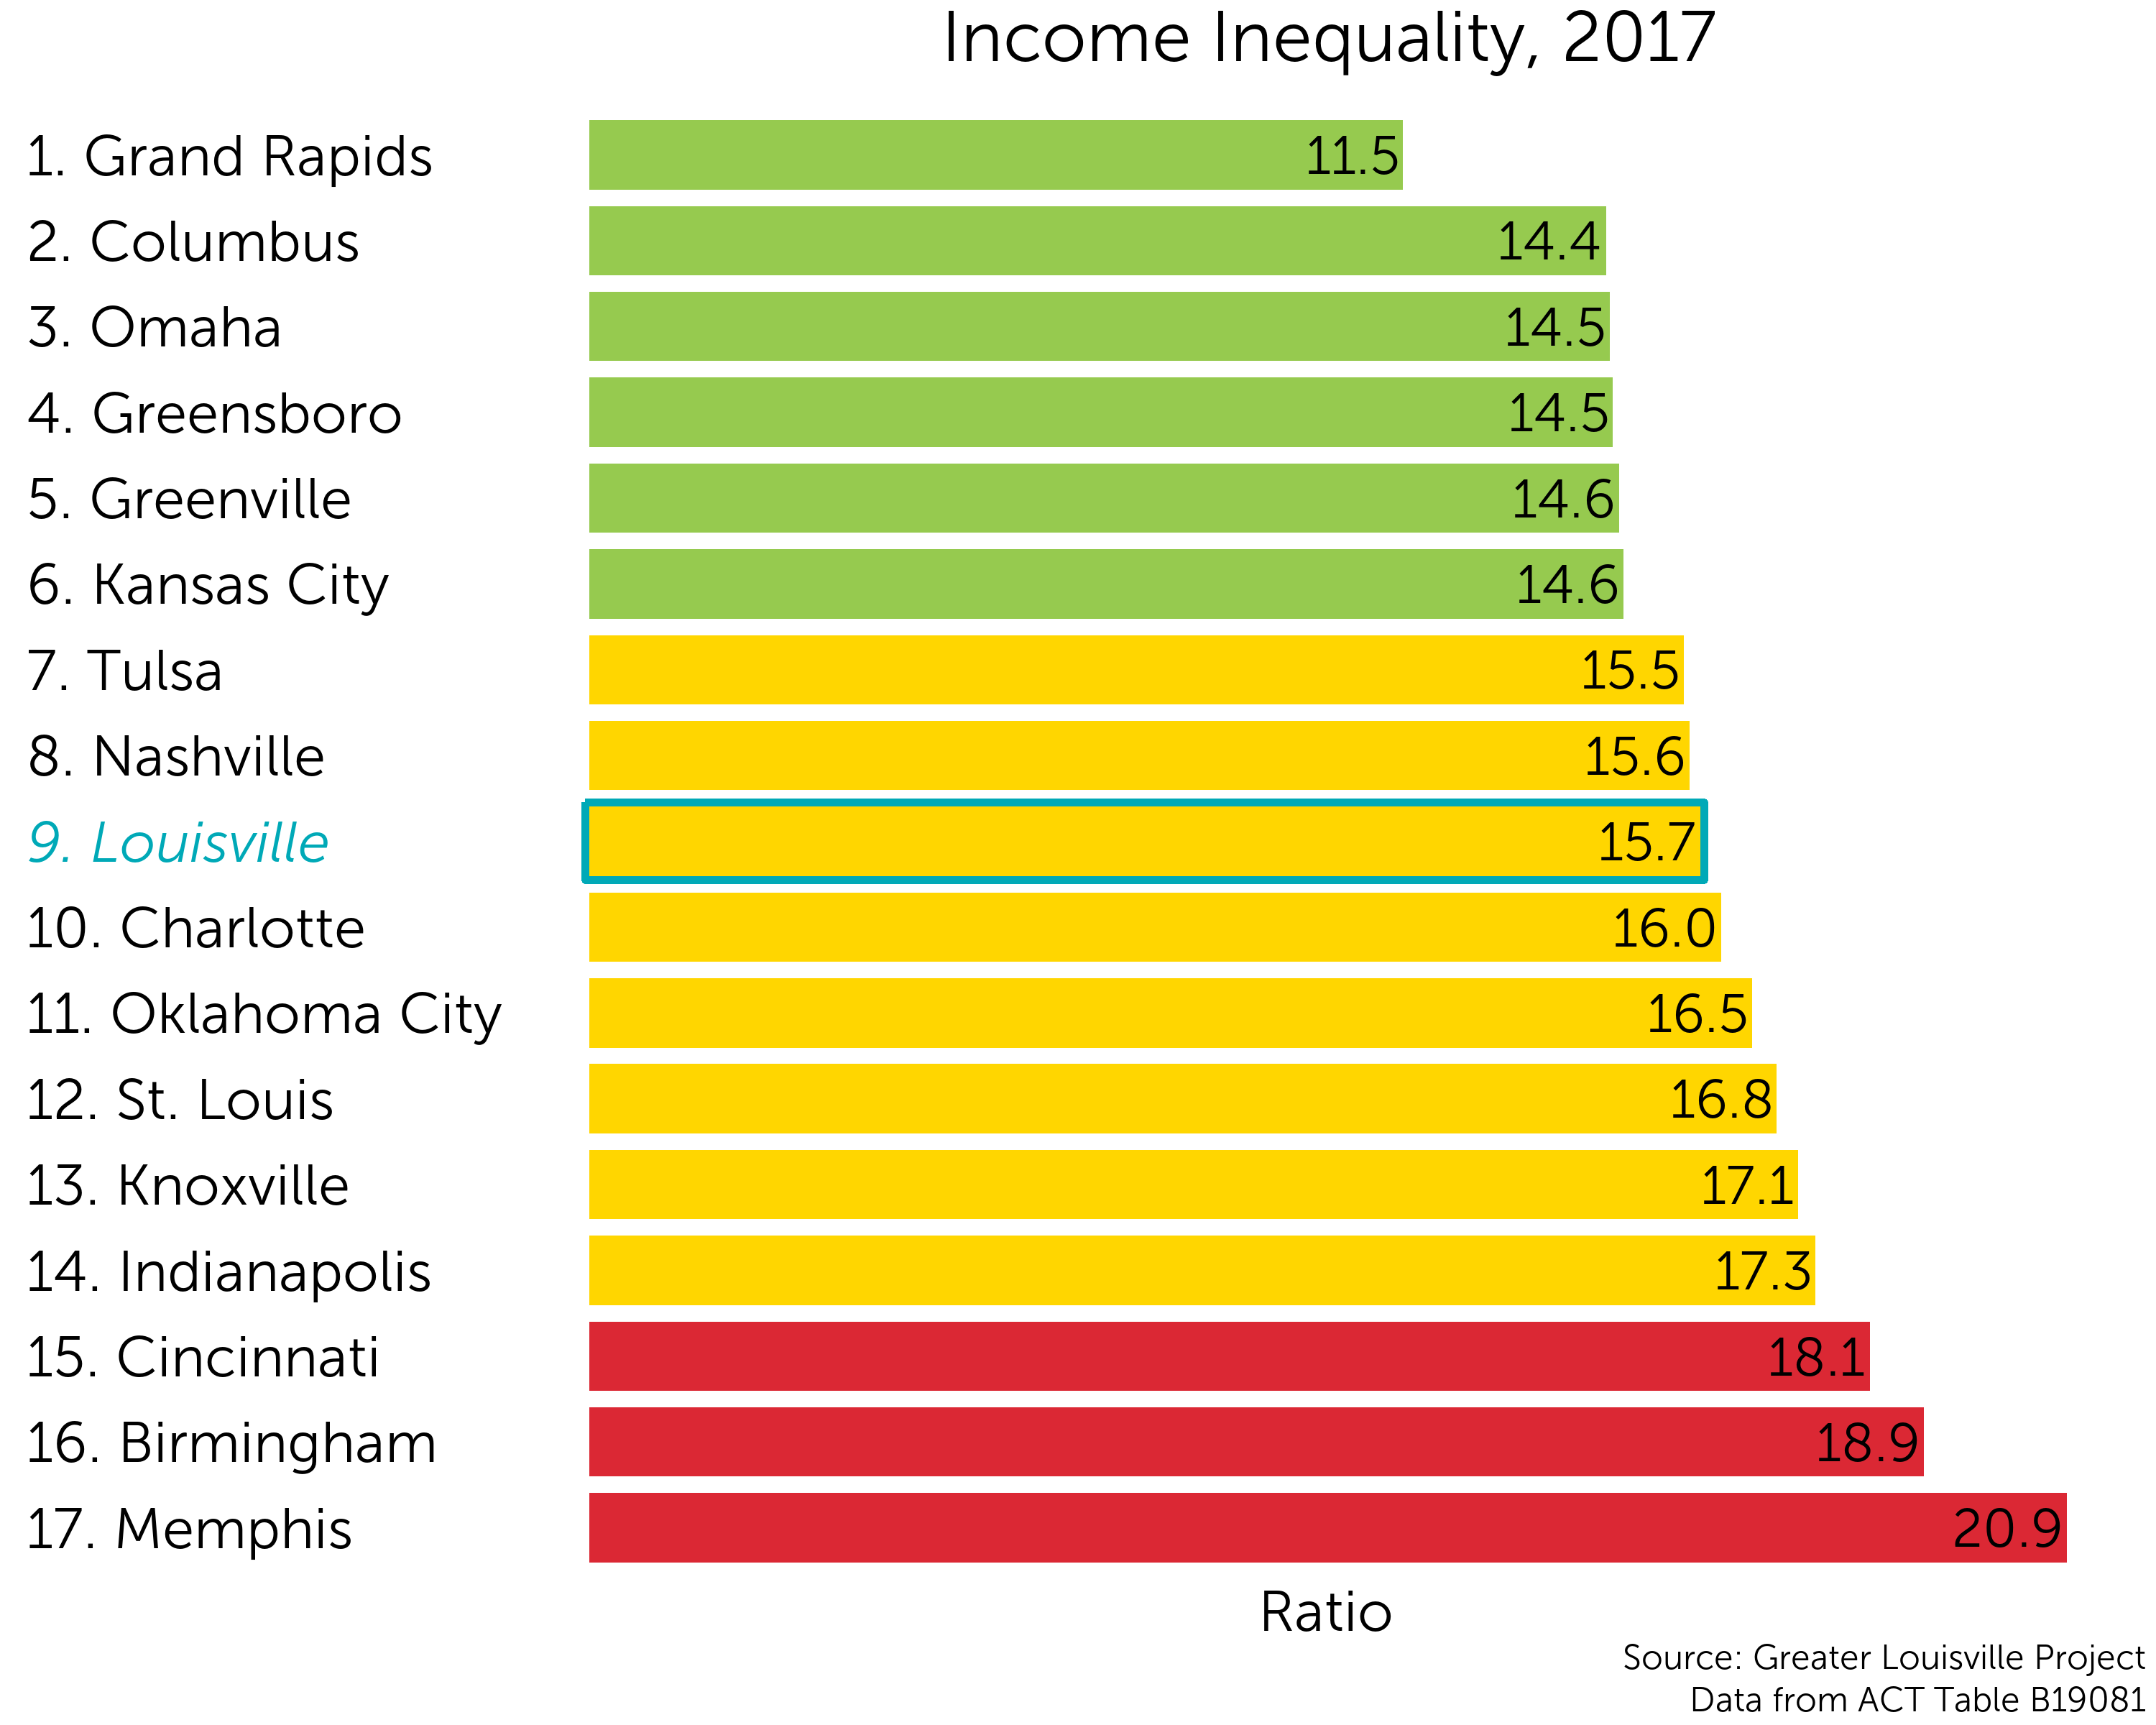
Louisville ranks 9th among its peer cities in income inequality. The average income of the top 20% of Louisville residents is 15.7 times greater than the average income of the bottom 20%.
Louisville ranks among the middle tier on this metric according to a natural breaks algorithm. Cities in green are those that outperform their peers, cities in yellow represent the middle cluster, and those in red are a group that lags behind its peers on this indicator.
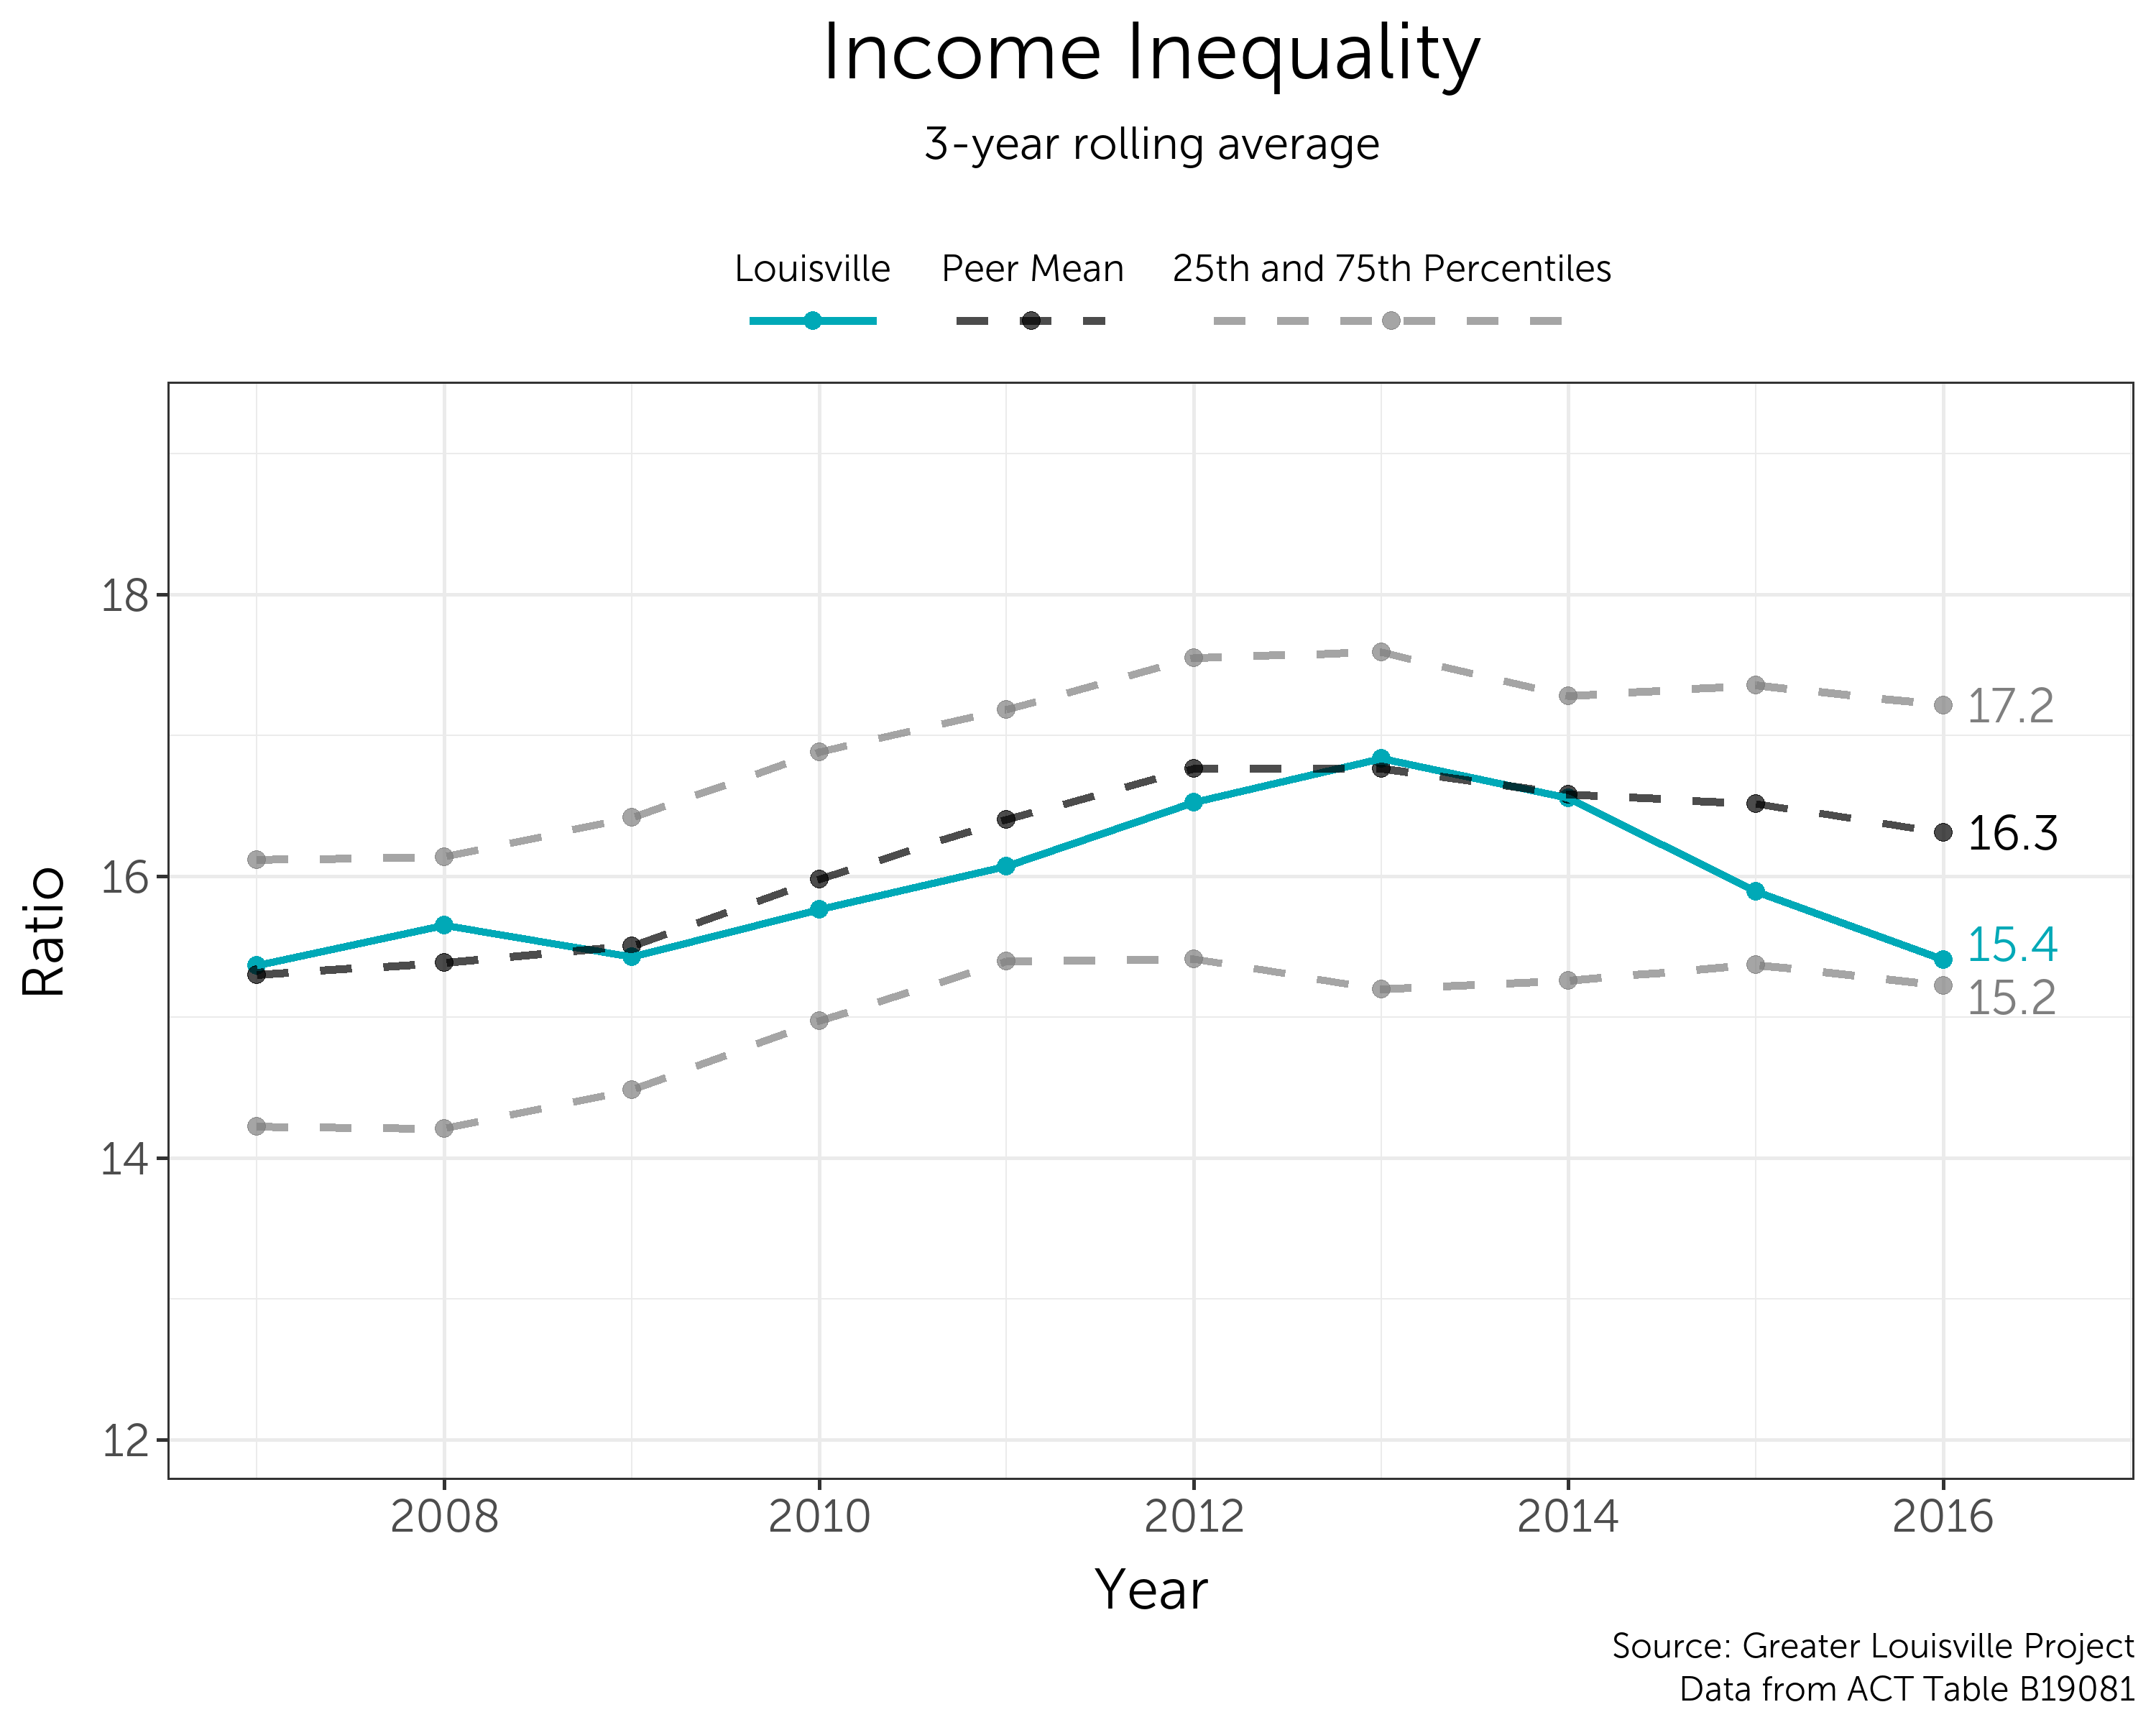
Trends Over Time
Income inequality in Louisville has been decreasing since 2013, returning to the same level as measured in 2007. Income inequality in Louisville has decreased from the peer mean and is approaching the 25th percentile.
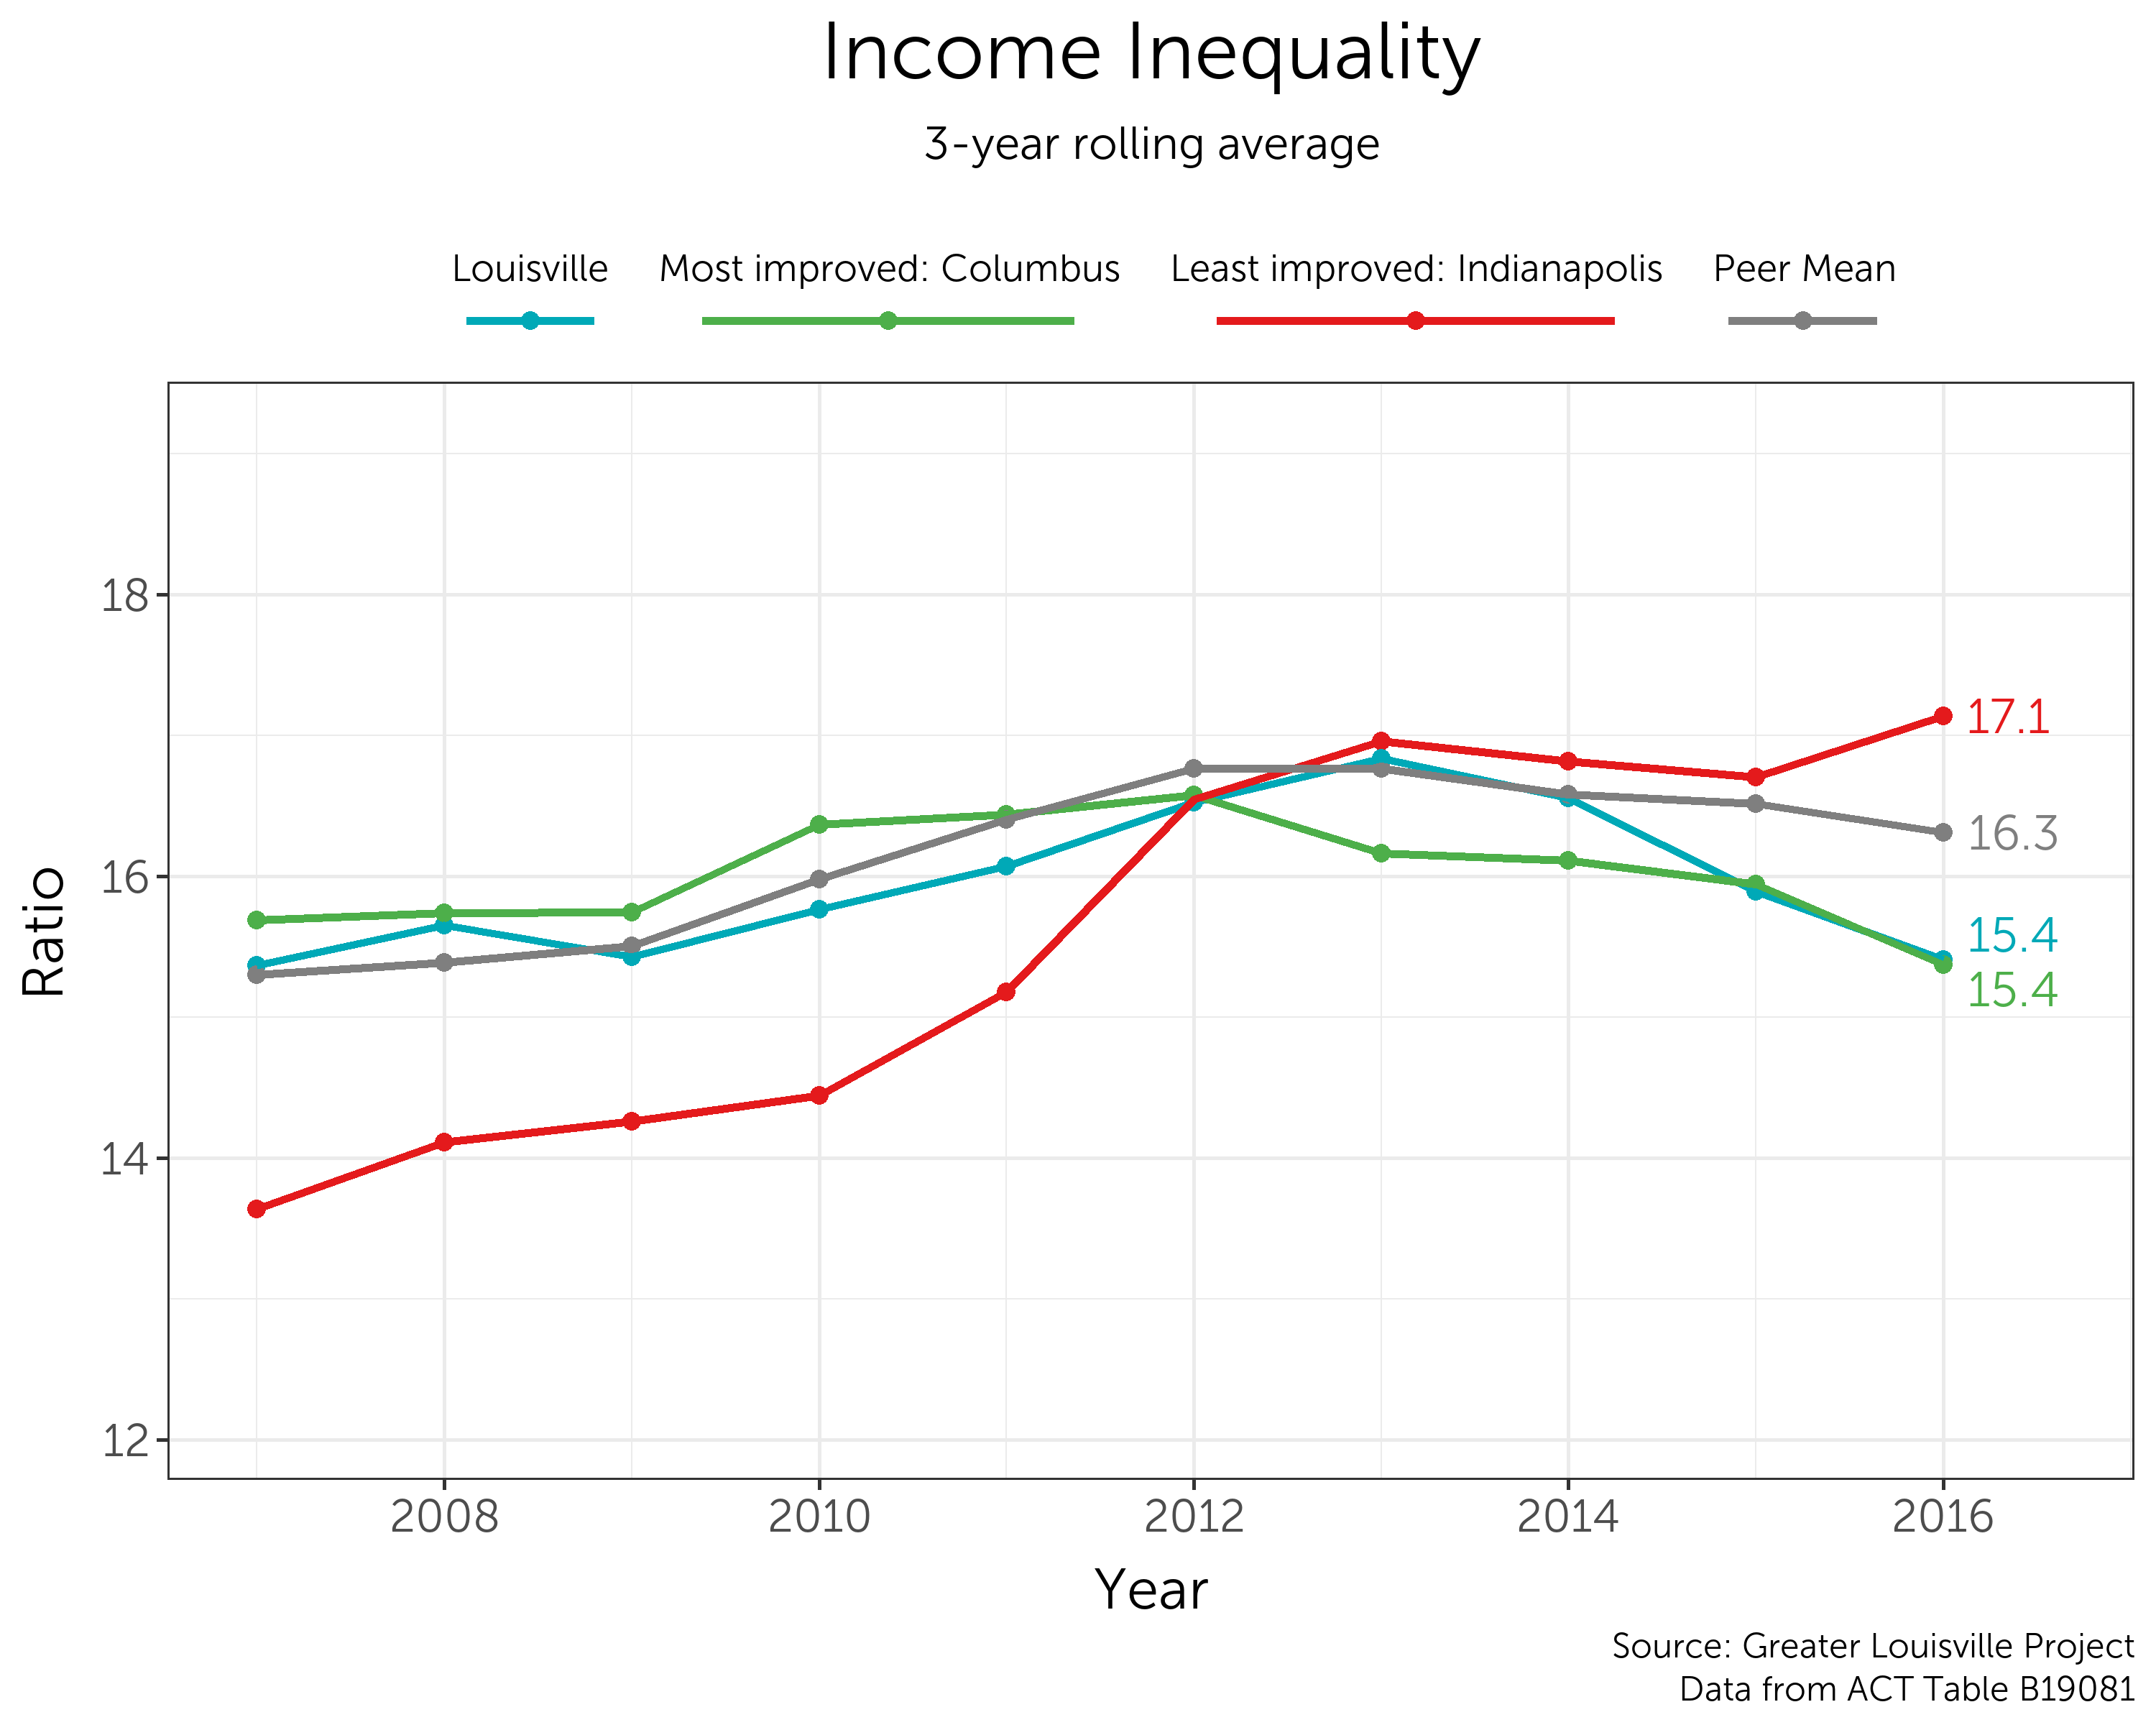
Comparison Between the Most and Least Improved Cities
The average peer city saw a slight increase in the income inequality ratio between 2007 and 2016. Columbus, the most improved city, saw a small decrease. Indianapolis, the least improved city, saw its income inequality ratio increase from 13.6 to 17.1.
Continue Exploring with Related Data
Disconnected Youth
The number of disconnected youth in a community is a good indicator of how that community is preparing its youth for a transition to adulthood. Disconnected youth often are not able to build their toolkit of skills for employment and often do not have the adequate social capital to fall back on in crisis situations. Because of these trends, disconnected youth are at a higher risk of experiencing homelessness or participating in criminal activity.
Peer City Perspective
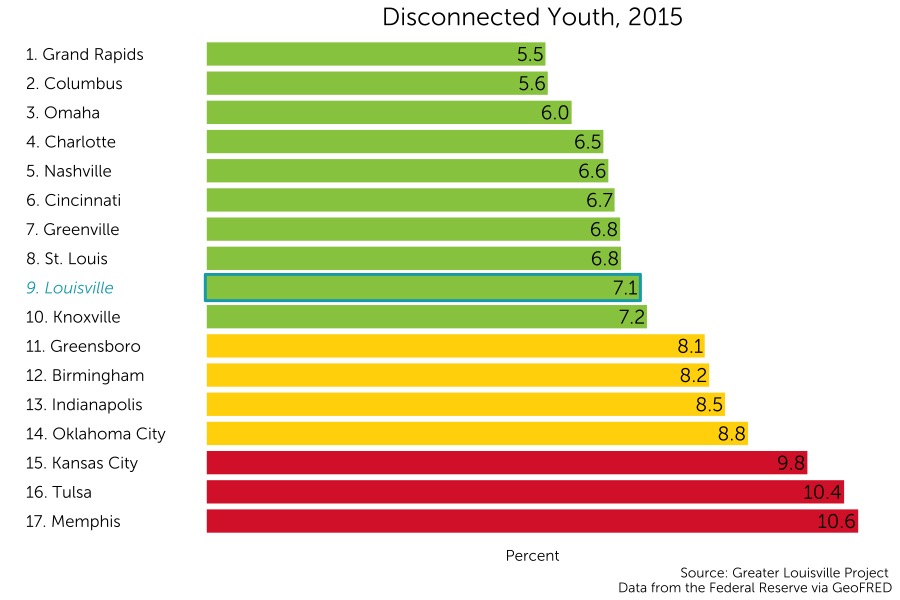
Louisville currently ranks 9th among its peers in rates of disconnected youth with a rate of 7.1%. A young person aged 16 to 24 is considered disconnected if they are neither working nor in school.
Louisville ranks among the top tier of its peer cities on this metric according to a natural breaks algorithm. Cities in green are those that outperform their peers, cities in yellow represent the middle cluster, and those in red are a group that lags behind its peers on this indicator.
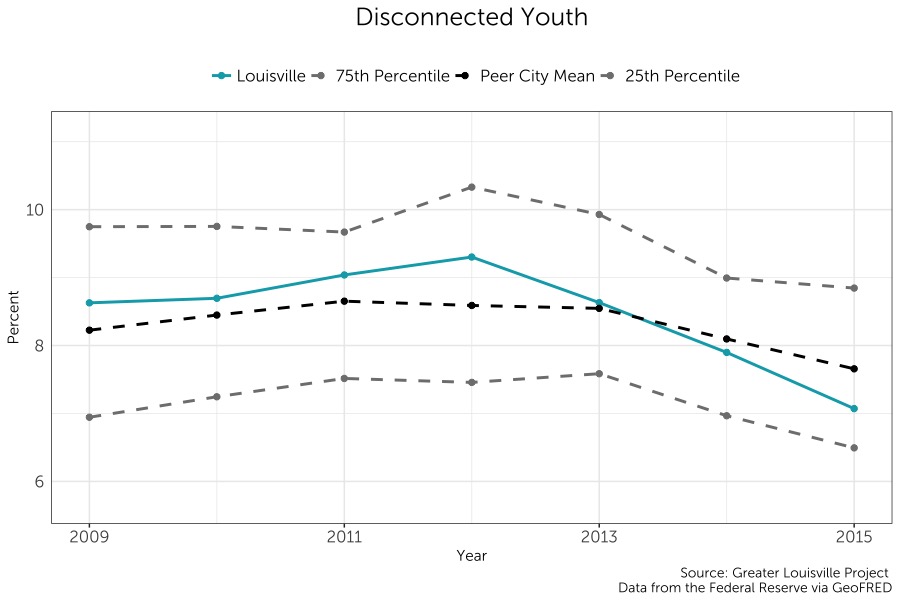
Trends Over Time
The rate of disconnected youth in Louisville has been rapidly decreasing relative to its peers since it reached a maximum in 2012. Louisville has reduced its rate of disconnected youth from above its peer city average in 2012 to below its peer city average in 2015.
Continue Exploring with Related Data
Food Insecurity
Access to nutritious food is a necessity for a healthy and prosperous lifestyle. Research has demonstrated that good nutrition is essential for healthy physical and social development. The Economic Research Service reports that households experiencing food insecurity have been characterized as likely to worry that they will run out of food, and often the food they are able to purchase does not last. Without food access, an individual faces disadvantages economically, socially, and in terms of their health.
Peer City Perspective
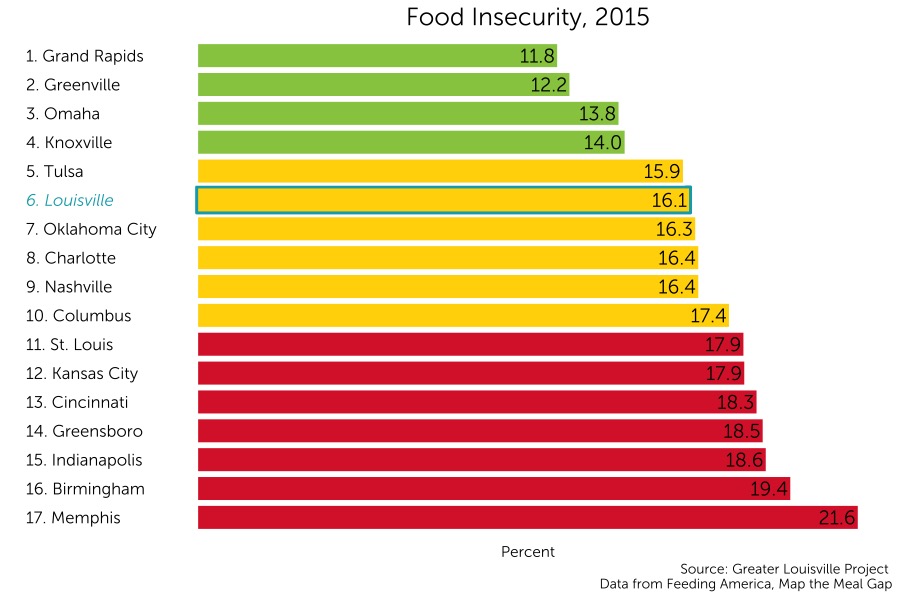
Louisville currently ranks 5th among its peer cities in food insecurity with 16.1% of residents experiencing food insecurity. Additionally, Louisville ranks 2nd in rates of children who live in a household experiencing food insecurity with a rate of 17%. The USDA defines food insecurity as lacking enough food for an active, healthy lifestyle for all members of the household.
Louisville ranks among the middle tier on food insecurity according to a natural breaks algorithm. Additionally, Louisville ranks among the top tier on child food insecurity according to a natural breaks algorithm. Cities in green are those that outperform their peers, cities in yellow represent the middle cluster, and those in red are a group that lags behind its peers on this indicator.
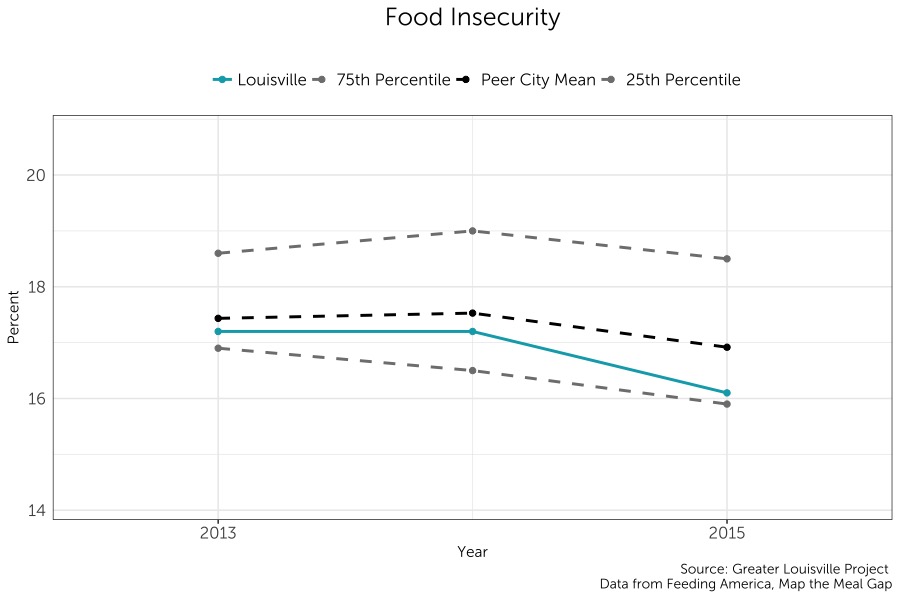
Trends Over Time
Louisville’s rate of food insecurity has decreased from 2013 to 2015. During this time period, Louisville’s rate of food insecurity was lower than its peer city average. Similar trends are observed in the food insecurity rates of children. In terms child food insecurity, Louisville’s rate is far below that of the 25th percentile of its peers.
Continue Exploring with Related Data
Food Deserts
Food deserts are a weakness in a city infrastructure’s ability to provide poorer residents with access to healthy food options. A lack of access to nutritious food options multiplies the barriers to health and wellbeing that individuals who live in multidimensional poverty face daily. For many living in food deserts, gas stations or convenience stores are the closest options for obtaining sustenance. For individuals already experiencing multidimensional poverty, living in a food desert can lead to malnutrition, obesity, or decreased educational and economic achievement.
Peer City Perspective
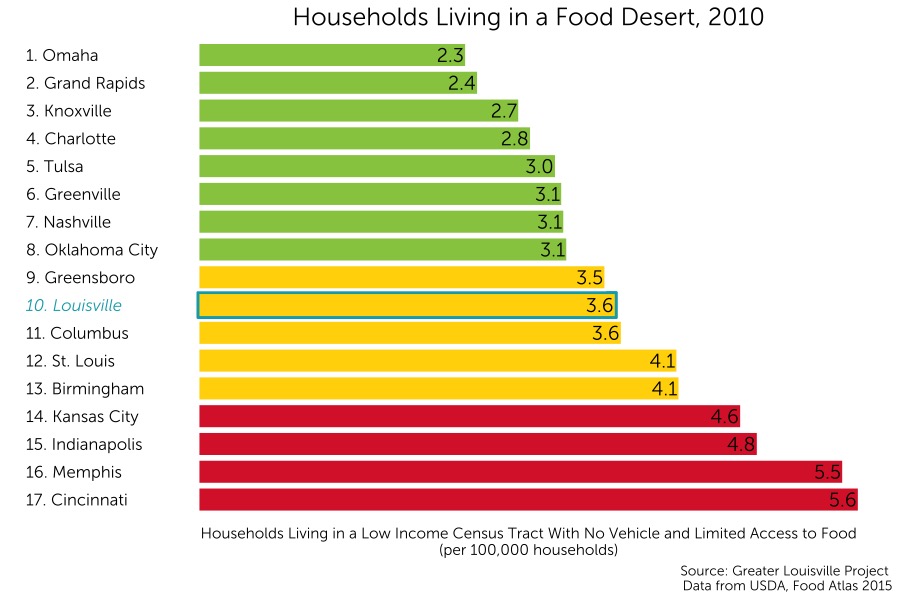
Louisville currently ranks 10th among its peers in households living in a food desert with 3.56% of households living in a food desert. A household is considered in a food desert if the household is in a low-income census tract, does not have a vehicle, and is farther than a half mile away from a supermarket.
Louisville ranks among the middle tier on this metric according to a natural breaks algorithm. Cities in green are those that outperform their peers, cities in yellow represent the middle cluster, and those in red are a group that lags behind its peers on this indicator.
Continue Exploring with Related Data
Racial Geography
In order to achieve a prosperous community in which all residents can participate fully, high levels of segregation in communities should be reduced. Although complete desegregation is not necessarily a desirable outcome due to the destruction of social capital built from within communities, fostering cultural exchange and horizontal relationships will yield greater economic and social prosperity, and ultimately stronger communities.
While there are many facets of diversity that one could study when considering segregation, race is most commonly associated with the practice of segregation. The present effects of a history of segregation across geographic and racial lines damage a community’s quality of life and stunt the development of community-wide prosperity and cultural exchange.
Peer City Perspective
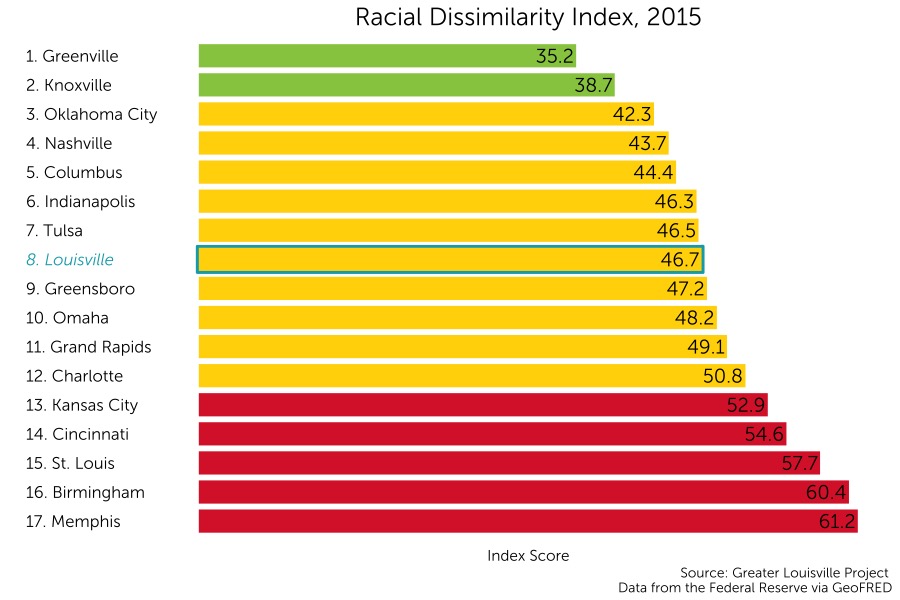
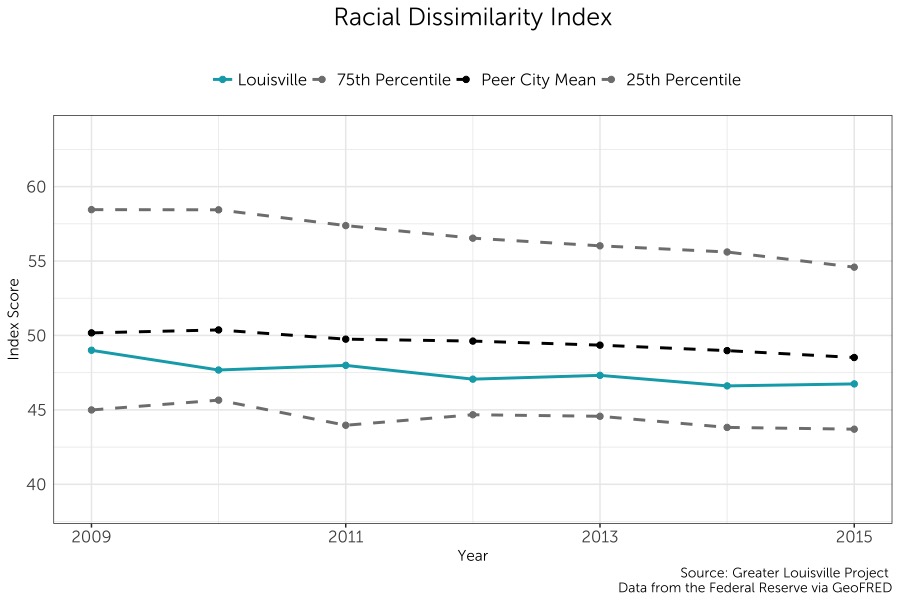
Louisville currently ranks 8th among its peers in the index of dissimilarity when considering white and non-white residents. The index of dissimilarity can be interpreted as the percentage of residents in a given city that would be required to move to a new census tract in order to achieve the citywide ratio of white to non-white residents in each census tract, creating greater opportunity for cross-cultural exchange and horizontal relationship building. Higher index values indicate higher levels of segregation.
Louisville ranks among the middle of its peer group according to a natural breaks algorithm. Cities in green are those that outperform their peers, cities in yellow represent the middle cluster, and those in red are a group that lags behind its peers on this indicator.
Where are Minority Residents Concentrated?
Louisville’s minority residents are highly concentrated in the West End and in the Buechel neighborhoods. The percentage of white residents is as low as 0.3% in one tract of Algonquin. The St. Matthews and Southeast Louisville neighborhoods have the highest percentages of white residents.
Scroll over the map to see values for each census tract. Zoom in to see street names that form the boundaries of each tract.
Trends Over Time
The Index of dissimilarity has decreased slowly from 2009 to 2015 in Louisville, suggesting that the city has experienced low-rates of integration since 2009. Louisville has consistently had a lower index score than the average of its peers.
Volunteerism
Volunteering builds social capital which leads to stronger, more resilient communities. In addition to satisfaction for the volunteer, individuals who volunteer can help solve community-wide problems and build relationships. Additionally, volunteering has been linked to health benefits such as lower mortality rates and improved mental health.
Peer City Perspective
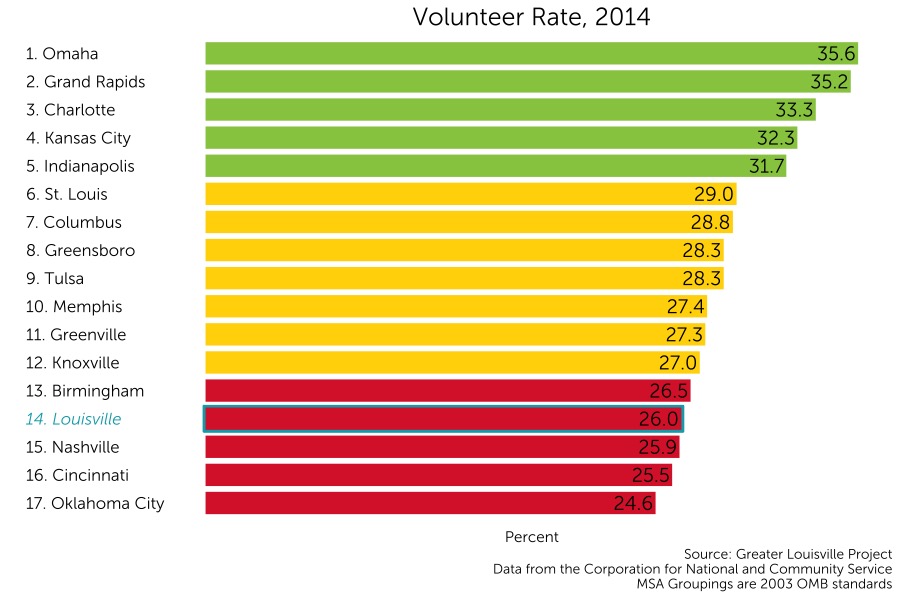
Louisville currently ranks 14th among its peers in volunteerism with a rate of 26%. The volunteer rate is calculated from American Community Survey data asking respondents if they have volunteered at least once in the past year.
On this metric, Louisville ranks among the bottom tier of its peer cities according to a natural breaks algorithm. Cities in green are those that outperform their peers, cities in yellow represent the middle cluster, and those in red are a group that lags behind its peers on this indicator.
Trends Over Time
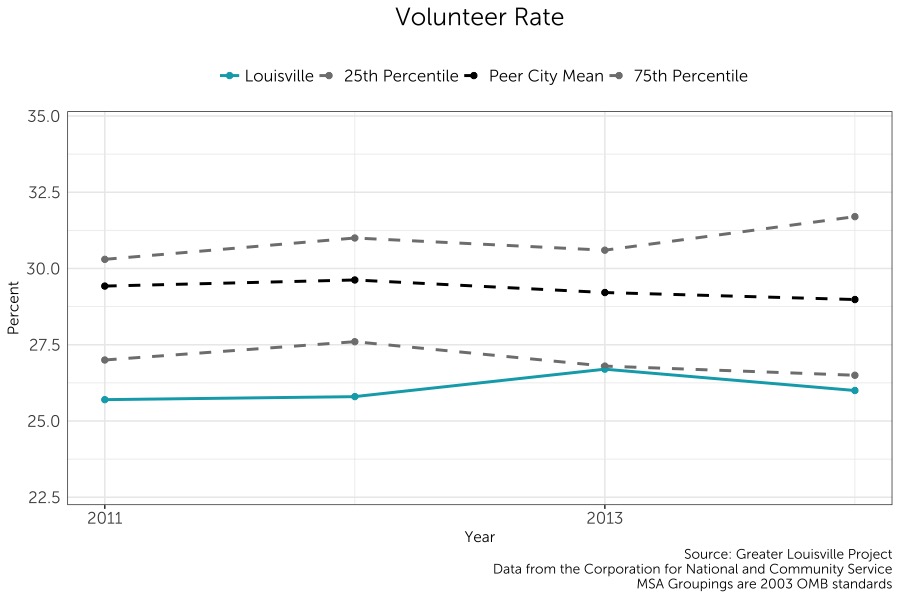
Louisville’s rate of volunteerism has slowly increased from 2011 to 2014. However, Louisville’s volunteerism rate is still below the 75th percentile of its peers.
Natural Breaks Algorithm
For each indicator, Greater Louisville Project assigns cities into one of three groups (high-performing, middle-of-the-pack, and low-performing) based on how they compare to other cities. The assignment is based on how cities naturally cluster on that indicator. Sometimes, the differences between cities are very small, and the difference between a city ranked 5th and 6th could simply be a matter of the sampling error that arises from using survey data. Thus, rather than always make a division that declares the top 5 to be the top tier, we use a natural breaks algorithm to look for a cluster of cities that is outperforming the rest, a cluster that is about average, and a cluster that is lagging. This clustering gives us a better indication of where Louisville is thriving and where Louisville has room to learn from cities that are doing better.
Z-Scores
Z-scores (or standardization) is a way to combine data with different units of measurement into a single index. The z-score is a measure of how far away a city (or census tract, etc.) is from the average city. In order to be comparable across different units of measurement, the z-score is the distance from the mean measured in standard deviations (e.g. if Louisville has a z-score of 1 it means Louisville is 1 standard deviation above the mean of its peer cities).
Data from the Robert Wood Johnson Foundation's County Health Rankings use z-scores and all z-scores are relative to the mean of Louisville's peer cities. (On the County Health Rankings site z-scores are relative to all the counties in each state - thus z-scores reported by GLP will be different, because we are using a different reference group). The Greater Louisville Project also uses z-scores in our multidimensional poverty index, which compares each census tract to the mean of all census tracts in Louisville.