Kindergarten Readiness

Early childhood education encompasses the quality and accessibility of educational investment for kids under 6 years old. Research suggests that addressing childhood education is a critical factor in improving the future educational attainment and socioeconomic transition of low-income communities. Poverty creates many barriers that impede young children’s development, placing them at a disadvantage even before they enter the classroom. The metric associated with early childhood education is “kindergarten readiness,” in alignment with the Ready for K Alliance.

Kentucky school districts evaluate kindergarten readiness using the BRIGANCE Early Childhood Kindergarten Screen III, which assesses child development across five areas:

  • Academic/Cognitive Development
  • Language Development
  • Physical Development
  • Self-Help Skills
  • Social and Emotional Skills

For a deeper discussion of kindergarten readiness, its importance, and its limitations, please see our 2021 Early Childhood Report.

Trends Over Time

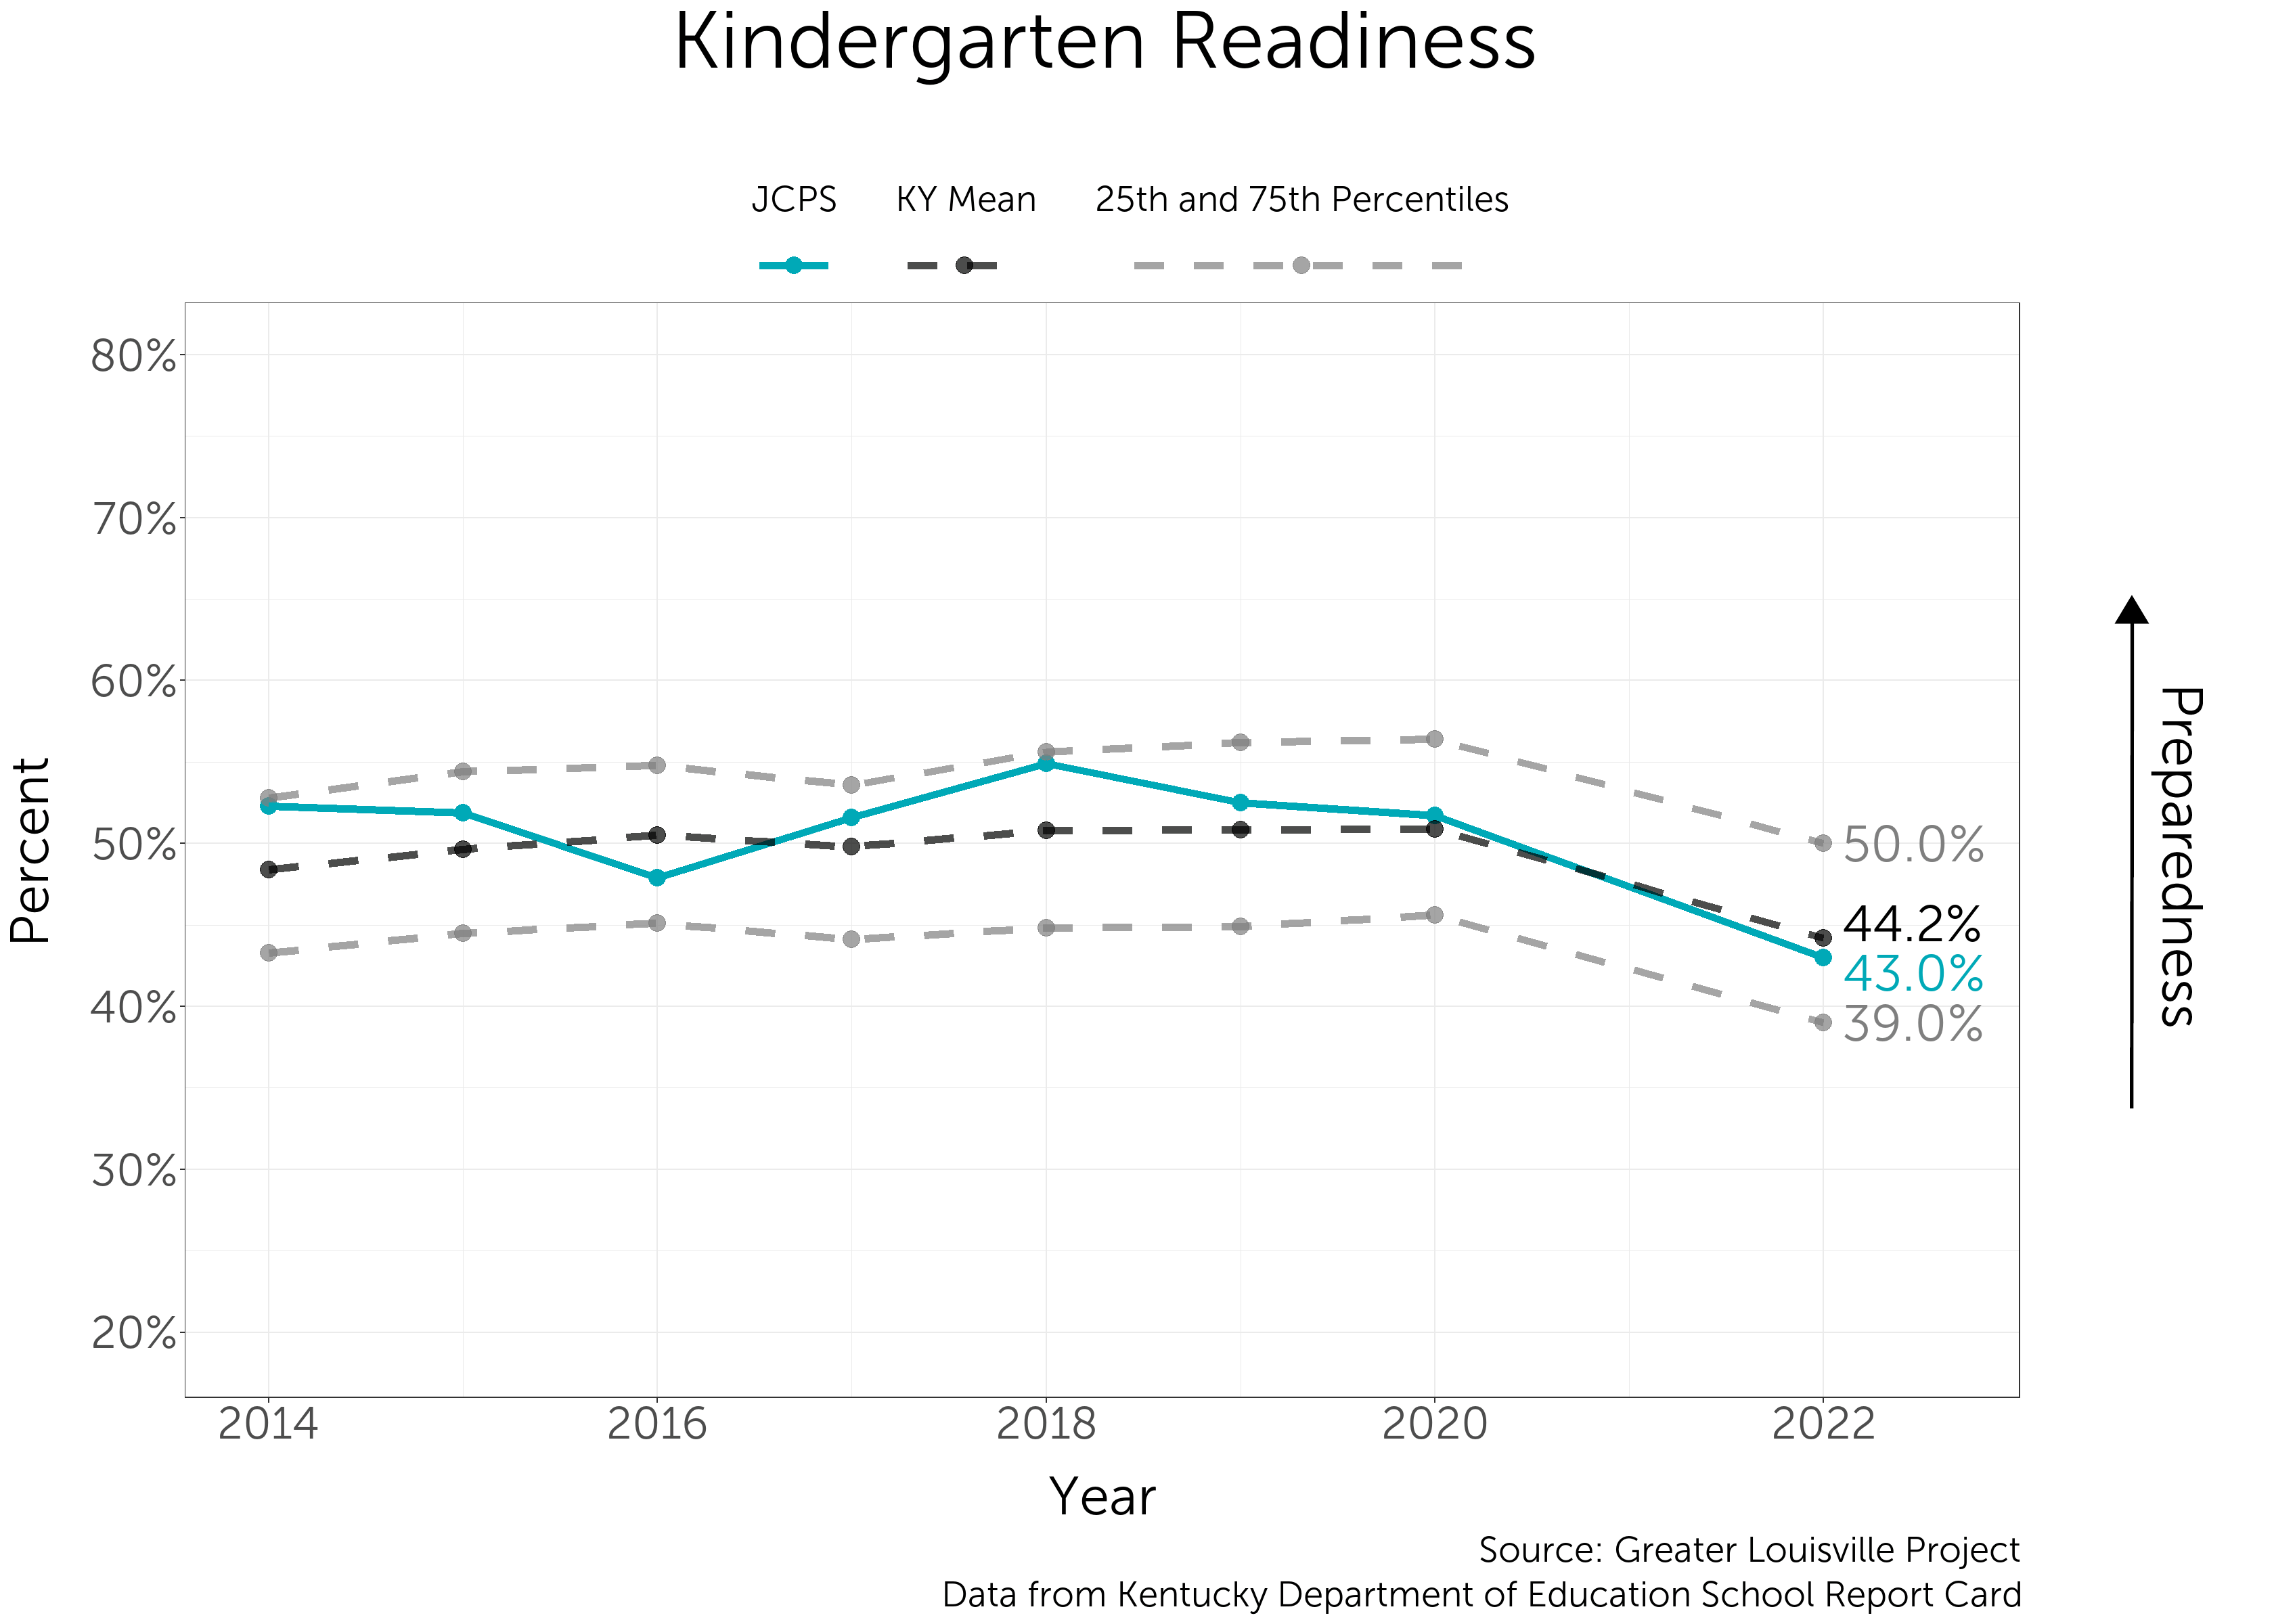
Louisville students have consistently scored near the state average for kindergarten readiness. While scores were relatively stagnant for many years, there was a sharp dropoff in kindergarten readiness over the course of the COVID-19 pandemic (as shown by comparing scores for the 2019-2020 school year with the 2021-2022 school year). This school year, only 43% of kindergarteners entered JCPS ready to learn.

Differences by Race

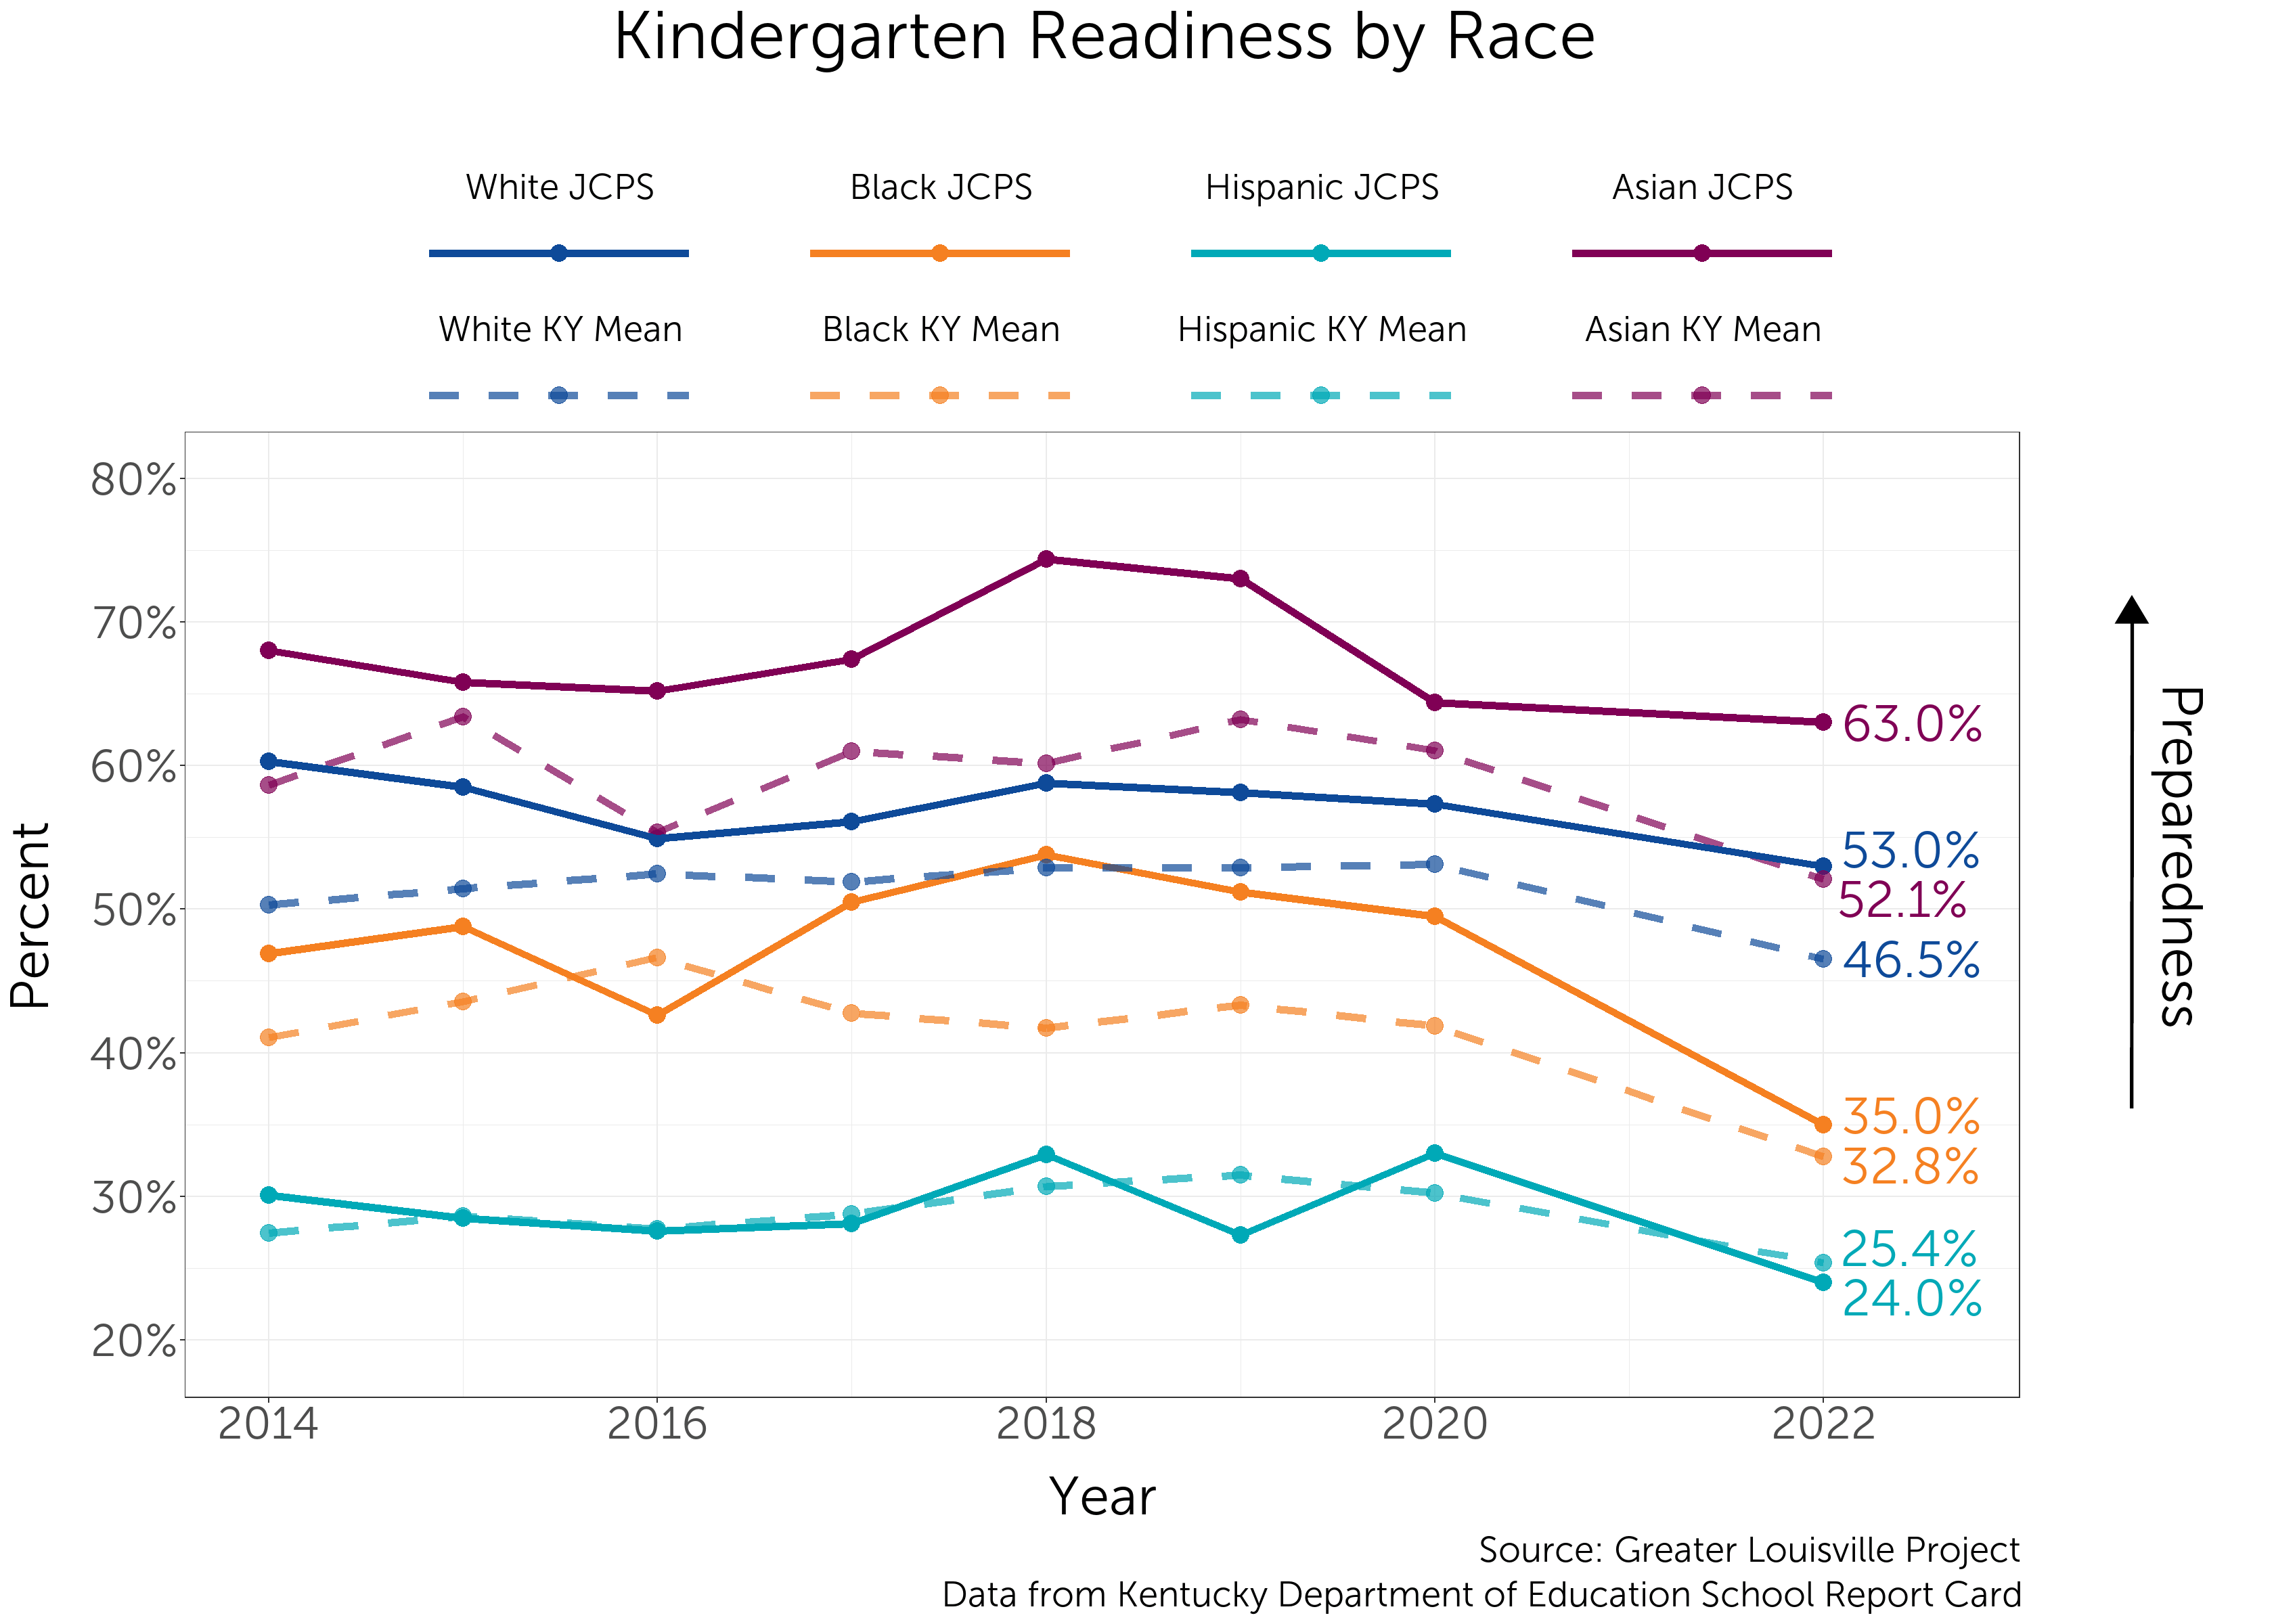
Since 2014, racial disparities in kindergarten readiness among JCPS students have persisted. Kindergarten readiness fell across all four demographics presented here from 2020 to 2022, with the largest decreases among Black students, followed by Hispanic students.

Differences by Sex

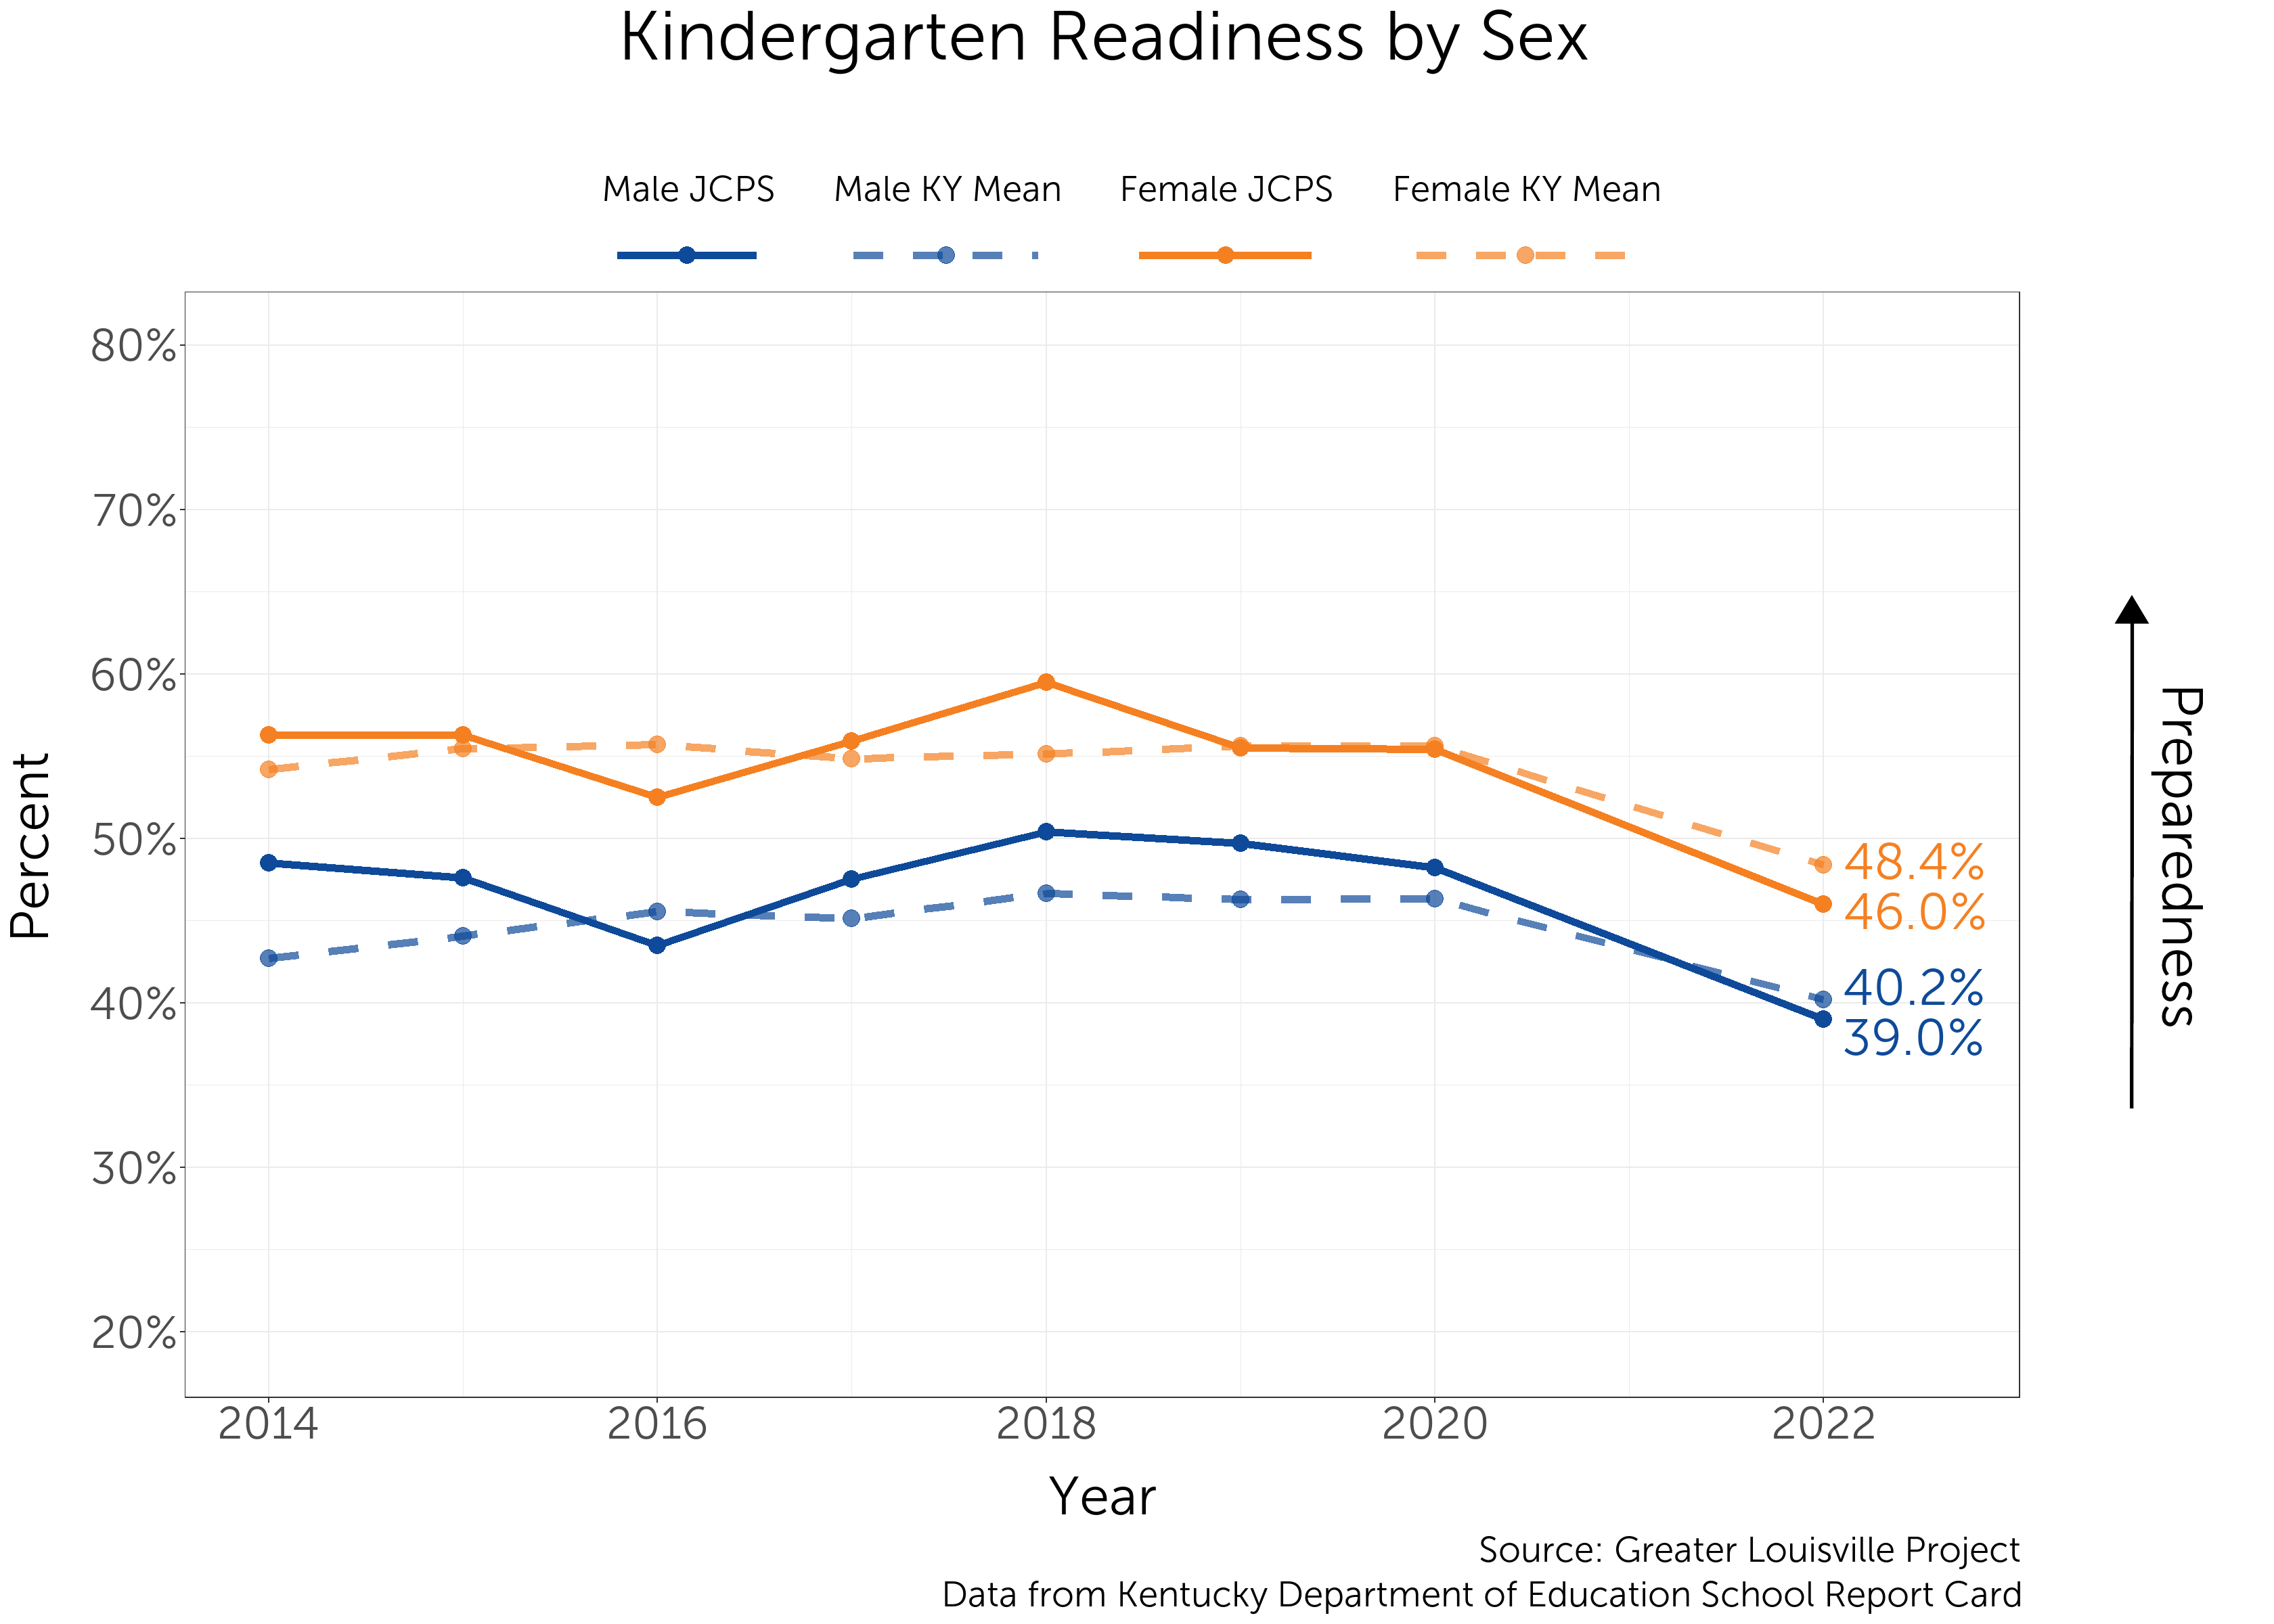
Females students enter kindergarten more prepared than their male counterparts in JCPS and Kentucky public schools. The gap in kindergarten readiness between females and males is slightly smaller in JCPS than it is in the rest of Kentucky.

Differences by Free or Reduced Lunch Status

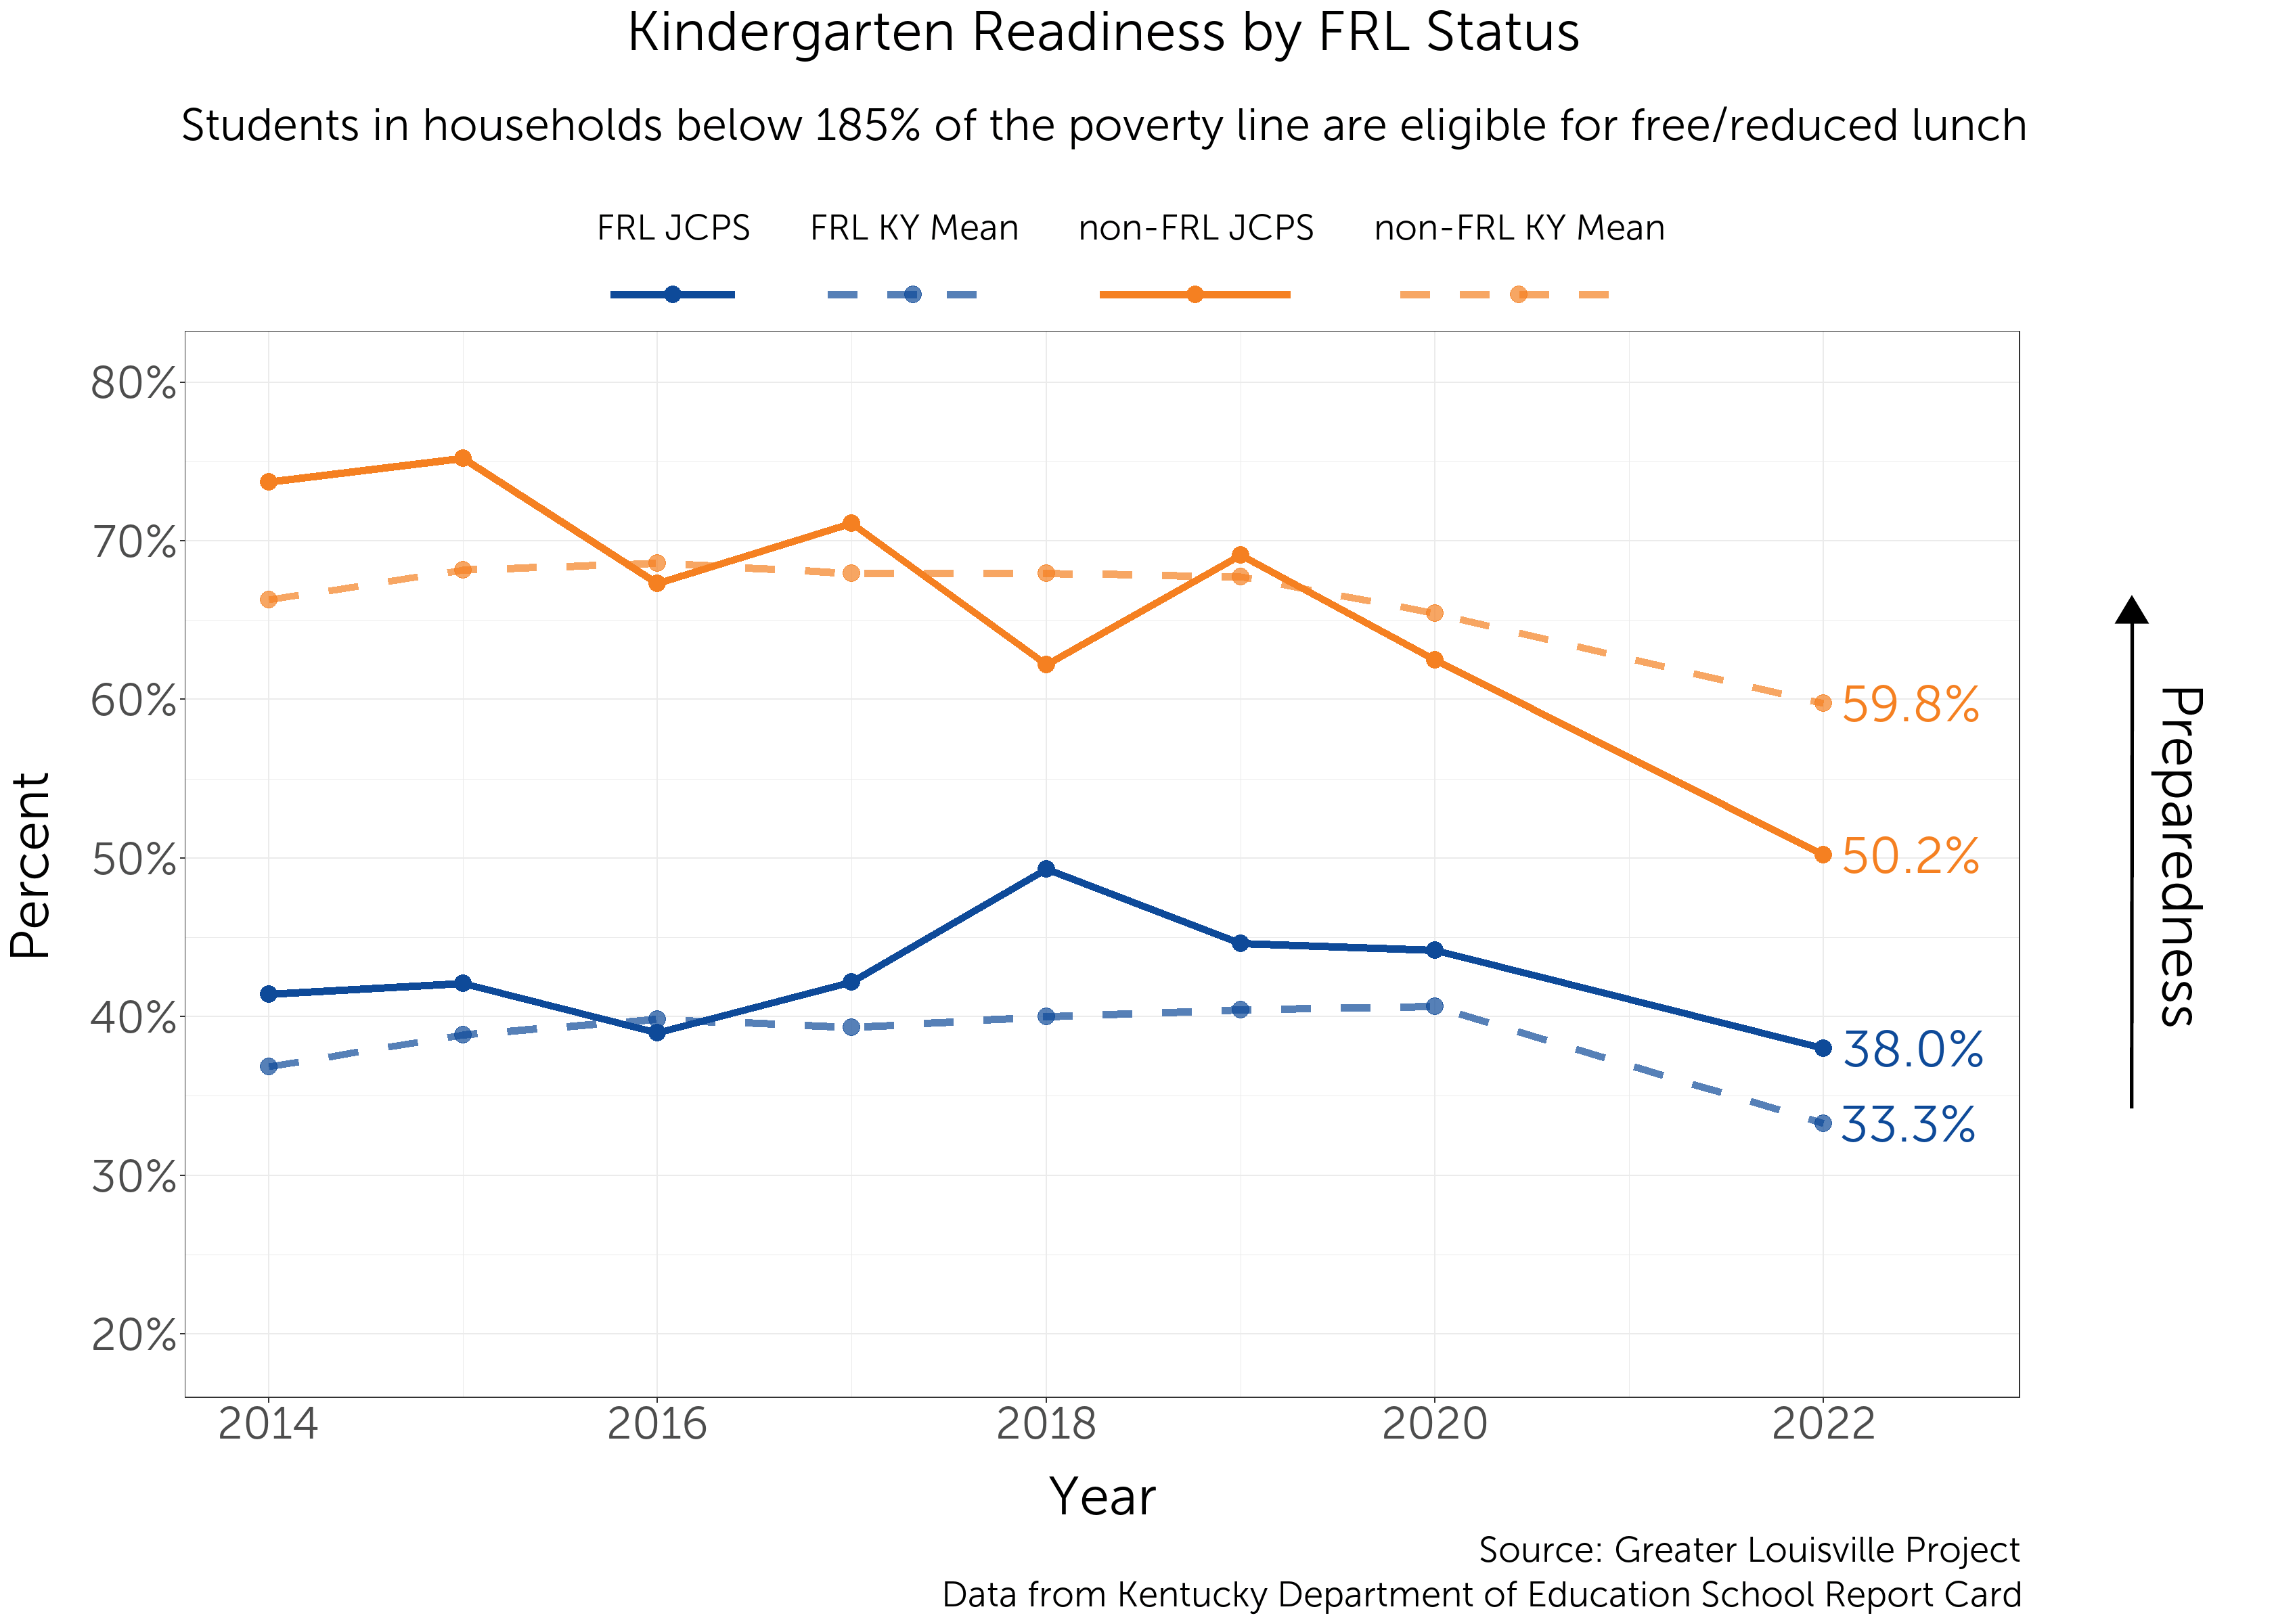
Breaking data down by Free or Reduced lunch eligibility gives us information o nhow kindergarten readiness relates to income. Students who qualify for free or reduced lunch lag behind their fellow students within JCPS and across the state of Kentucky. JCPS students not eligible for free or reduced lunch are performing significantly below the average for their Kentucky counterparts, while JCPS students eligible for free or reduced lunch outperform their peers in the rest of Kentucky. While both groups saw declines in kindergarten readiness over the course of the COVID-19 pandemic, students from higher-income families saw a much larger decline in kindergarten readiness.

How did we get these numbers?

Our data comes from files available through the Kentucky Department of Education and the JCPS School Report Cards. Most numbers come directly from the sources without much calculation required. You can download all of the files we used to create these graphs here, and you can see how we crunched the data here.

Some notes:

  • The years on the graphs represent the end of the school year. (E.g. The 2022 data point represents the 2021-2022 school year.)
  • While some data exist for 2021, at first glance, there were very few students who took the BRIGANCE screener, so we have excluded it entirely.
  • We calculated numbers for students not eligible for free or reduced lunch using data for all students and students eligible for free and reduced lunch.
  • All data on JCPS students come directly from spreadsheets. Due to missing student counts in some Kentucky school districts in some years, we have imputed some student counts for small school districts in some years to create state averages and 25th and 75th percentiles each year. We acknowledge this limitation but feel comfortable including those numbers here since their purpose is just to provide a comparison for our focus on JCPS.