Median Household Income
Median household income is an economic indicator commonly used as a proxy for quality of life. This metric is also often used to determine if residents in a given location are able to afford the cost of living of residing in that area. In conjunction with per capita income, median household income is used to determine the wealth of a given region. This metric includes both part-time and full-time workers.
Peer City Perspective
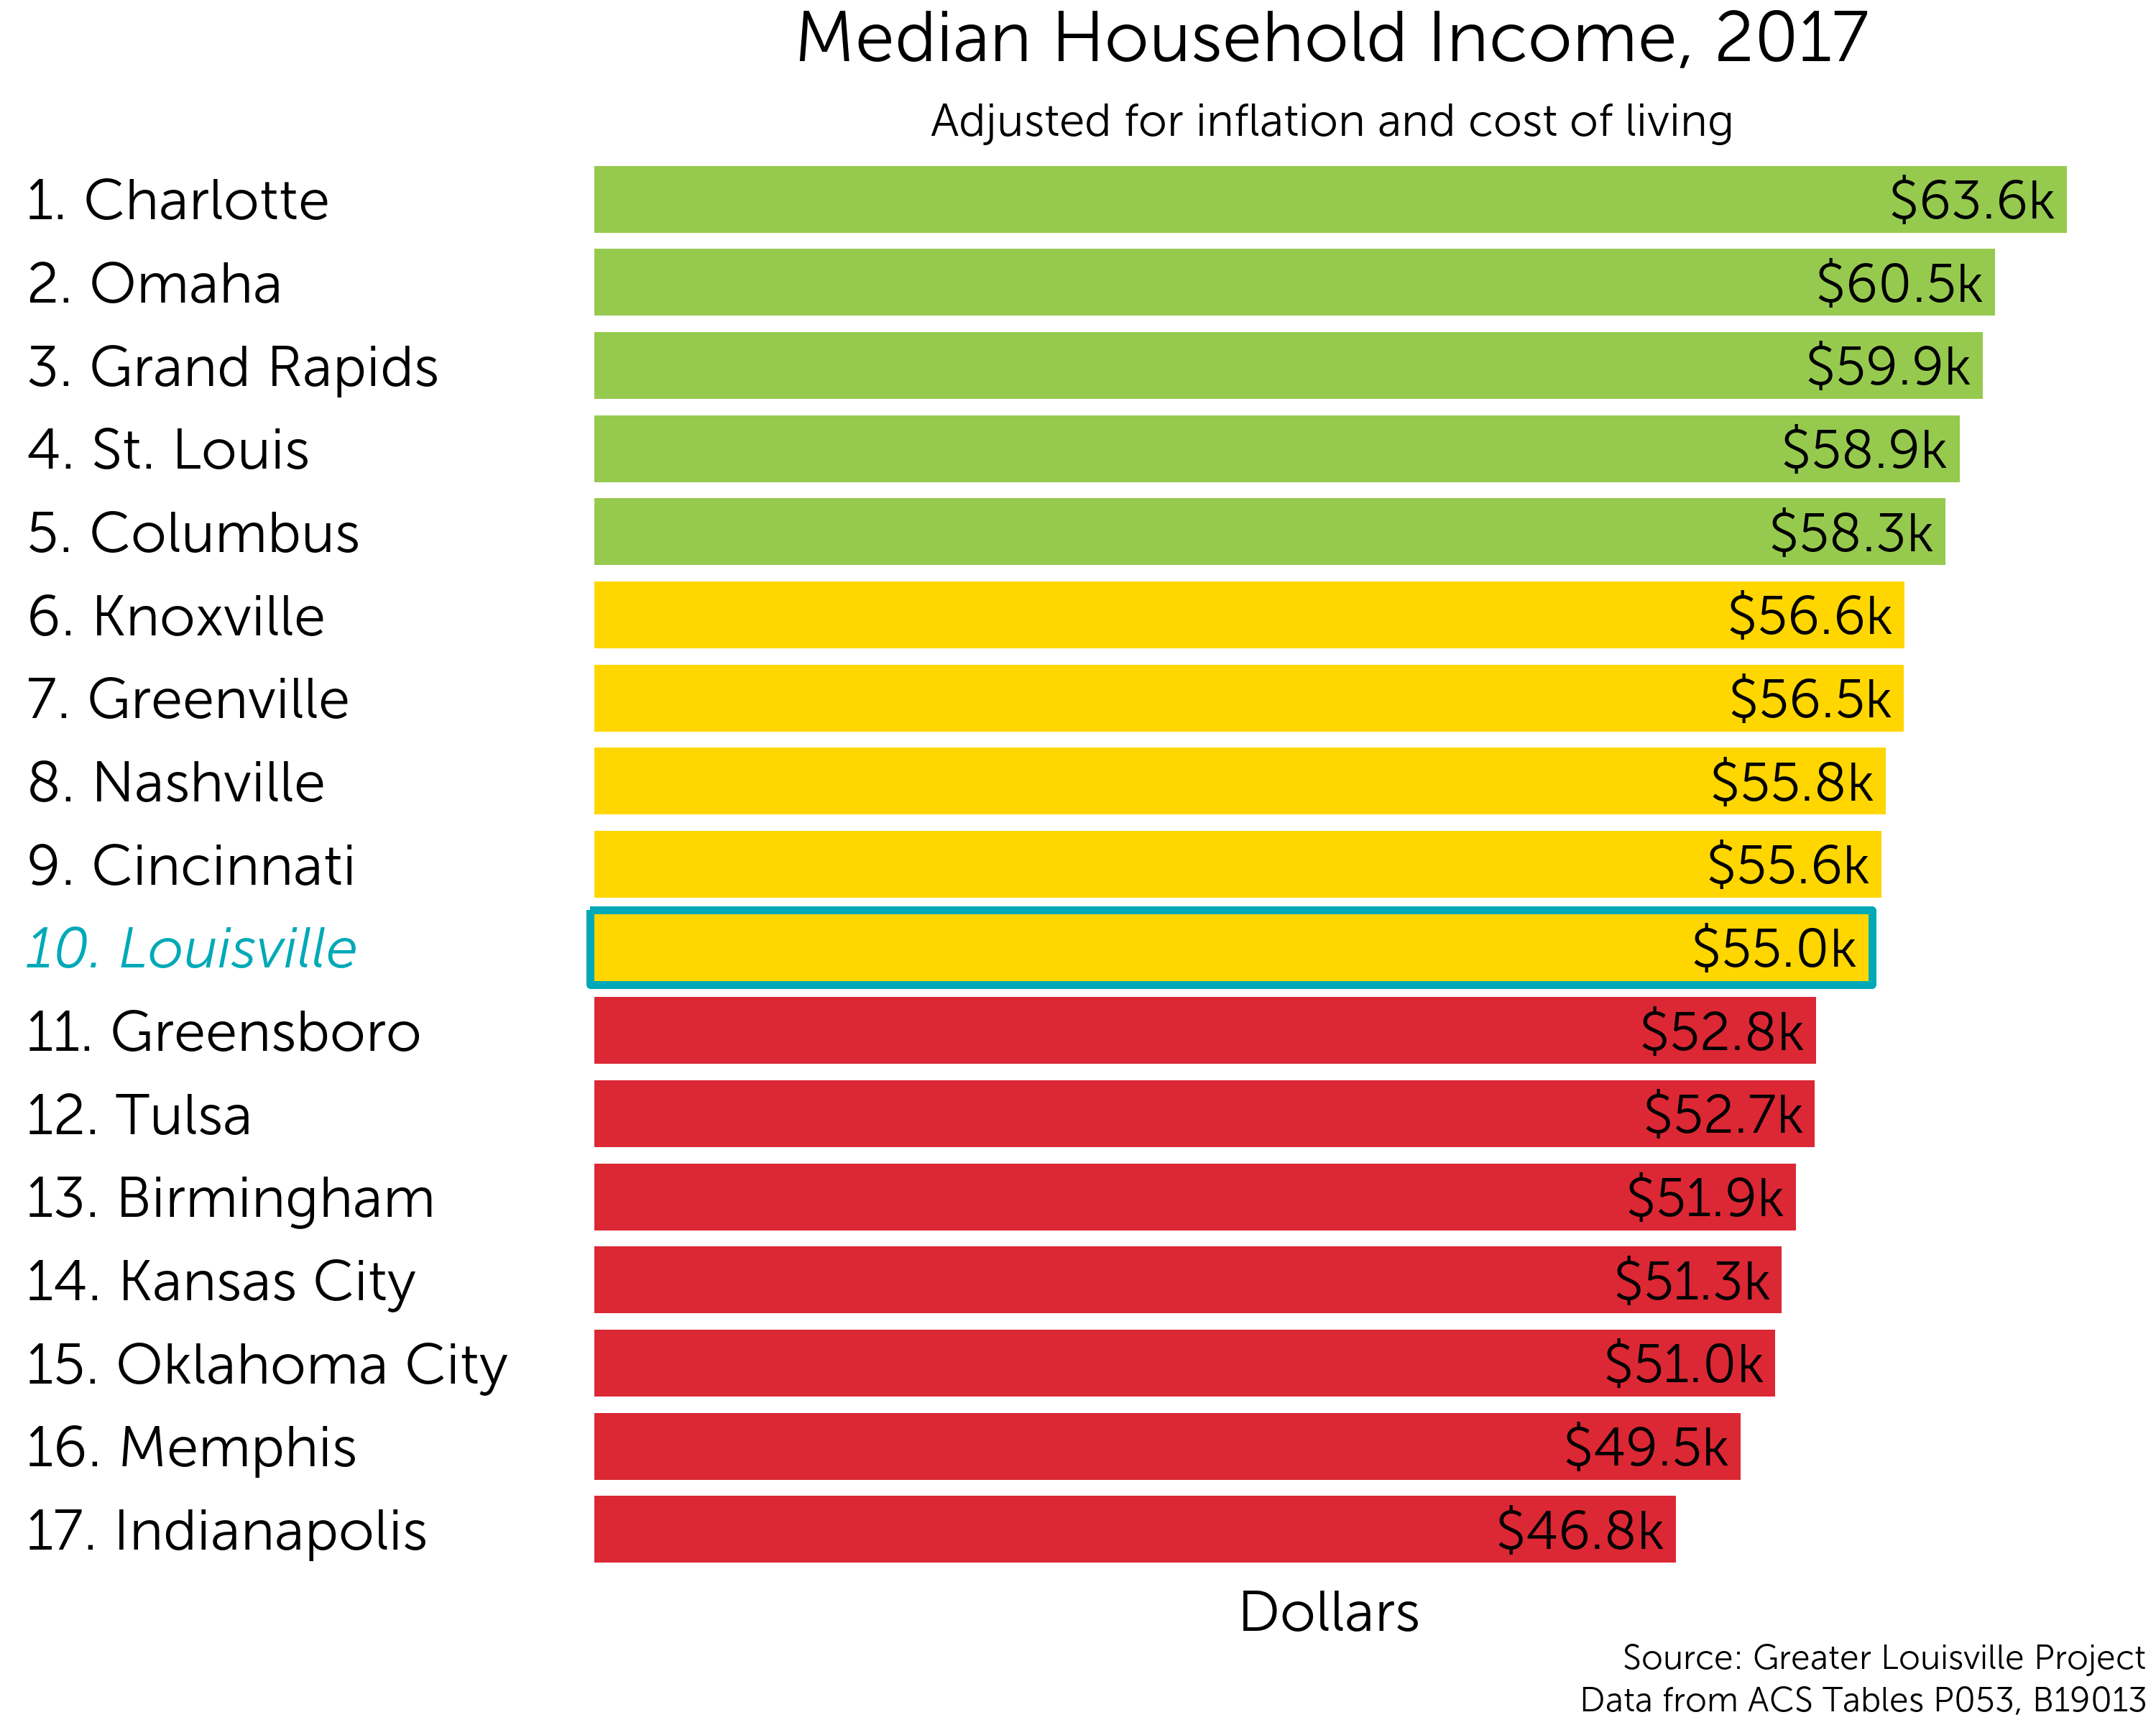
Louisville currently ranks 10th among its peer cities in median household income with a median income of $55,000.
Louisville is in the middle of its peer group according to a natural breaks algorithm. Cities in green are those that outperform their peers, cities in yellow represent the middle cluster, and those in red are a group that lags behind its peers on this indicator.
How does the median household income vary across Louisville?
There is tremendous variation in income across the city. In the map to the left, areas with higher median household income are displayed in green, and areas with lower median household income are displayed in red.
A dramatic divide in median household earnings exists in Louisville. Households in eastern Louisville receive higher median earnings than those in West Louisville. As showcased on the map to the left, households in Floyd’s Fork garner a median earning of over $80,000. Households downtown and in Old Louisville garner a media wage of only $17,800. Residents in the Phoenix Hill and Smoketown receive a median earning of $18,200. Russell neighborhood households receive a median income of $20,400.
Scroll over the map to see values for each census tract. Zoom in to see street names that form the boundaries of each tract.
Trends Over Time
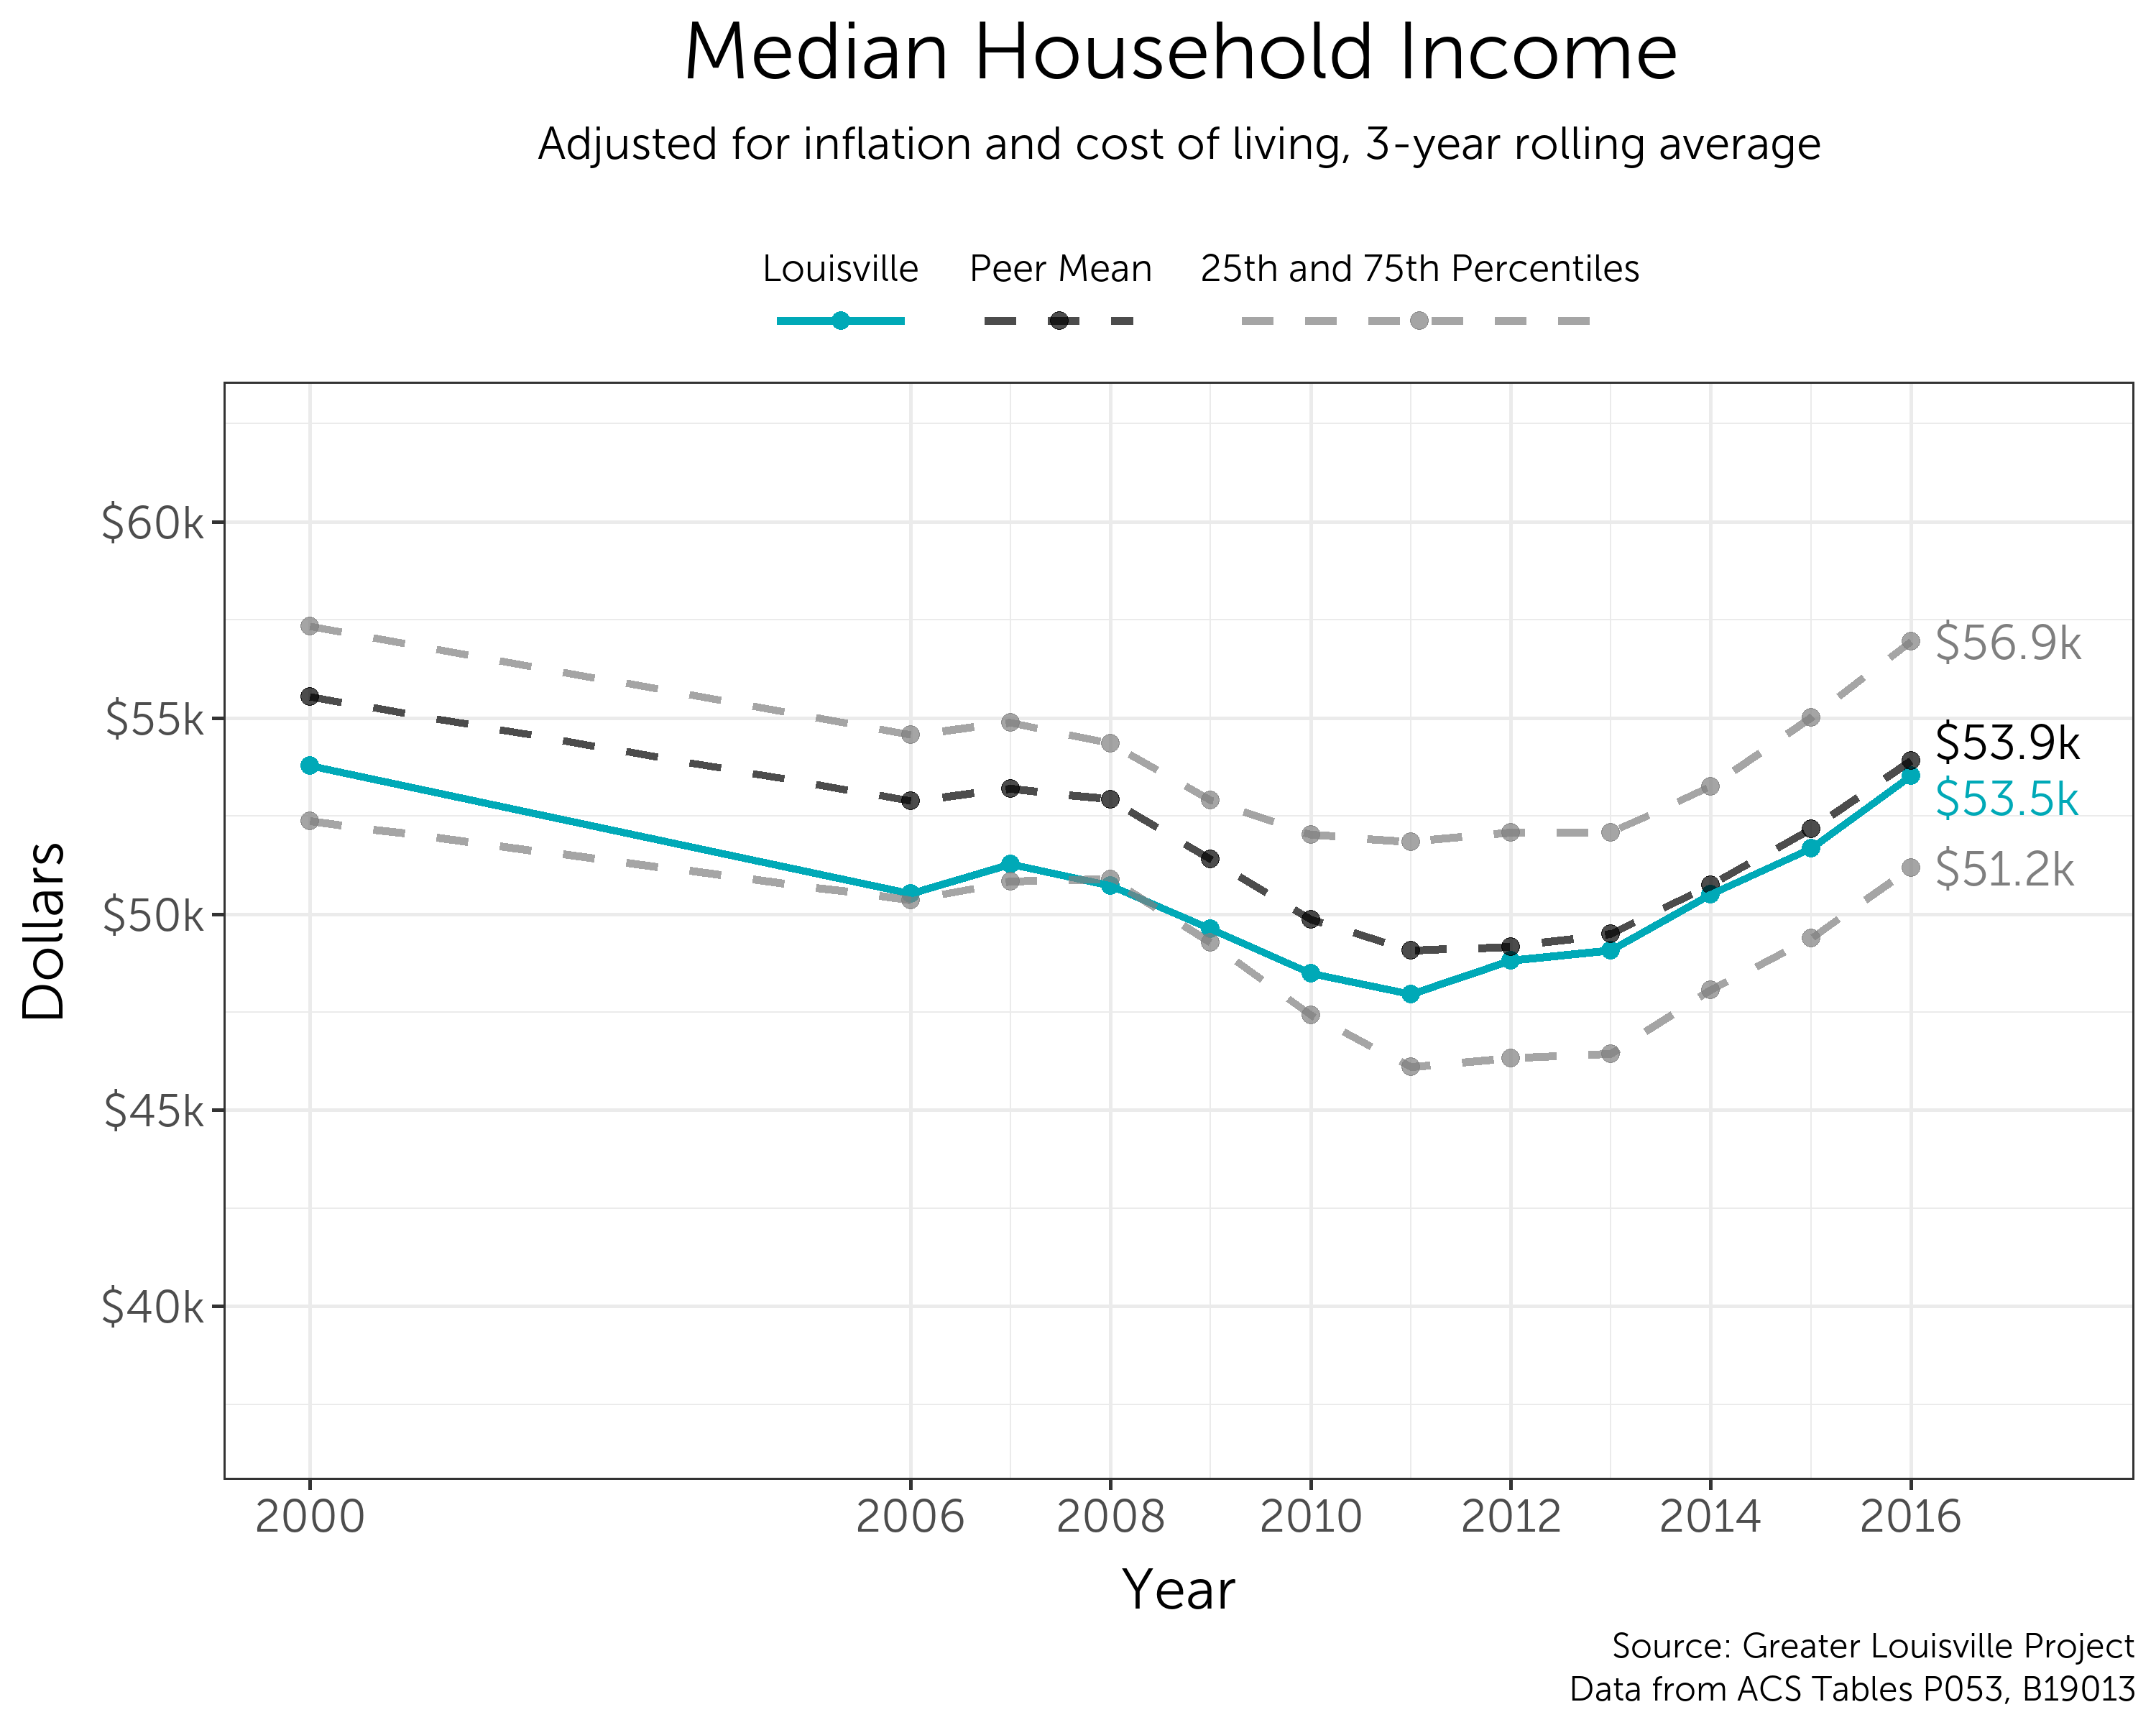
After a period of decline from 2000 to 2009, Louisville’s median household income began to rise. Since 2011, median household income in Louisville has seen a steady rate of improvement relative to its peers and moved from close to the 25th percentile to near the peer mean.
Comparison Between the Most and Least Improved Cities
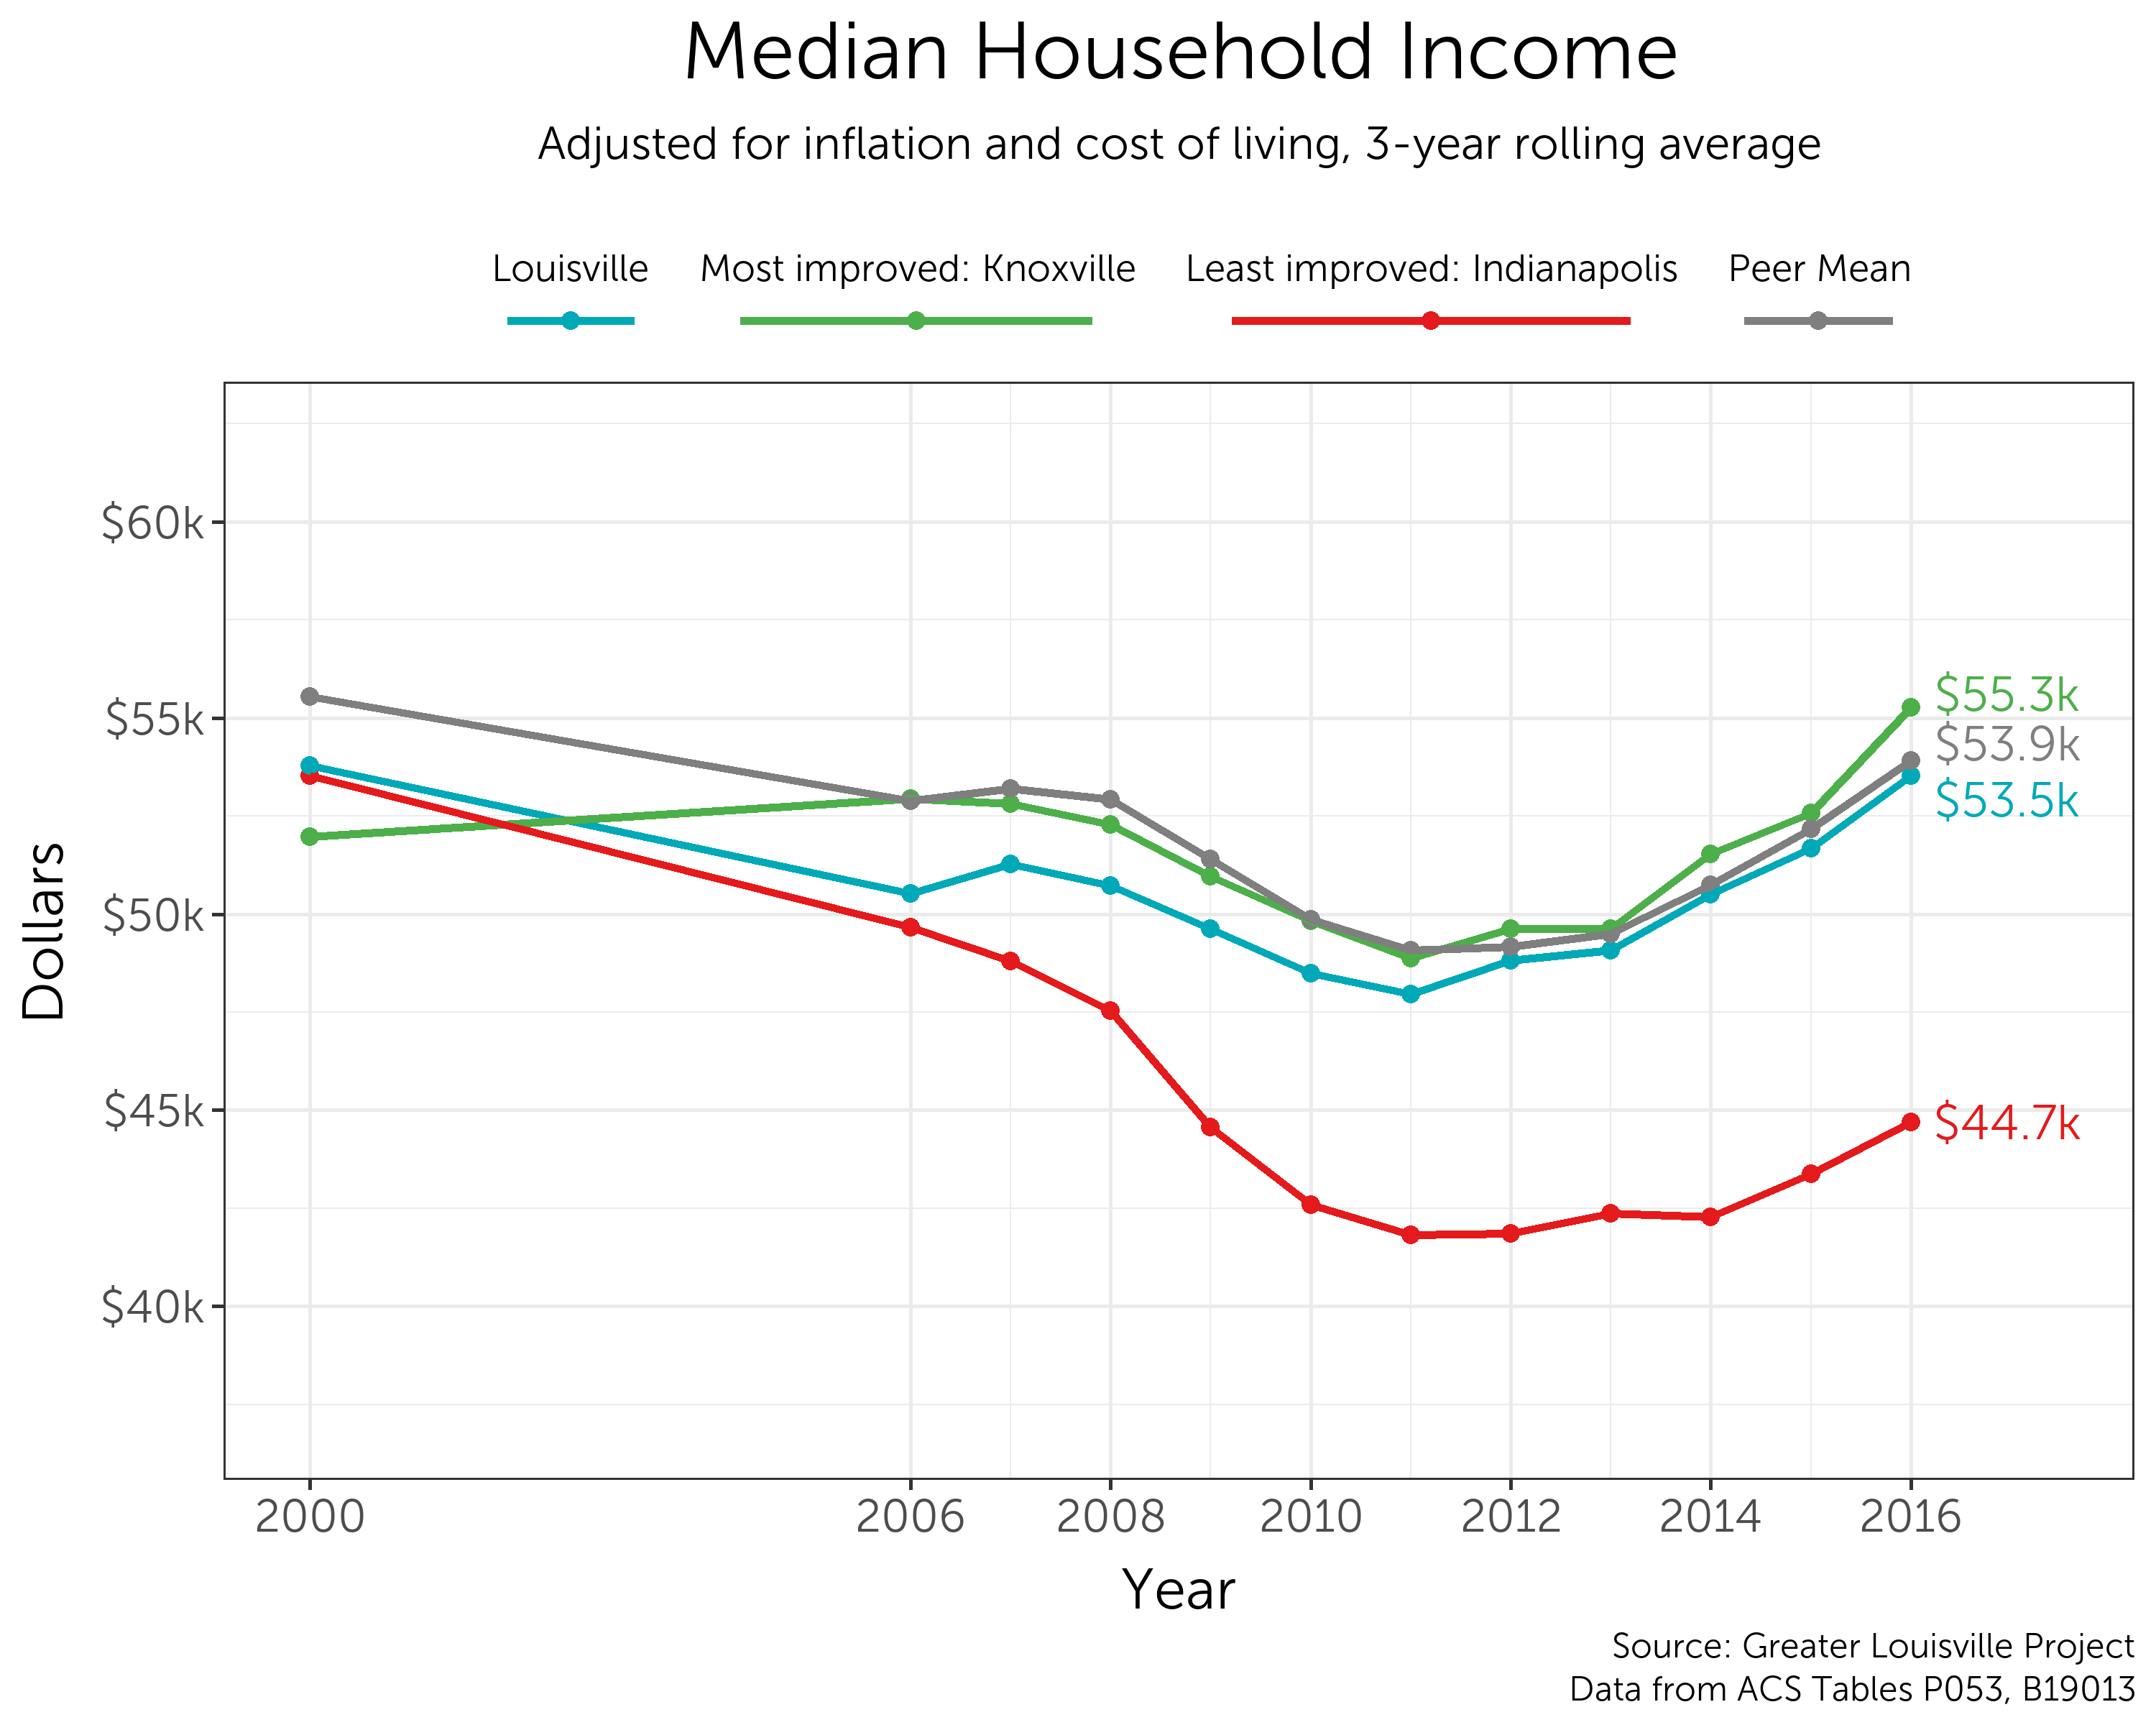
The median income in Knoxville, the most improved city, increased from $3,500 below the peer mean in 2000 to $1,400 above the peer mean in 2016. Louisville’s median household income decreased by $300, compared to an average decrease of $1,600 among peer cities. Median household income in Indianapolis, the worst-performing peer city, decreased by almost $9,000.
Continue Exploring with Related Data
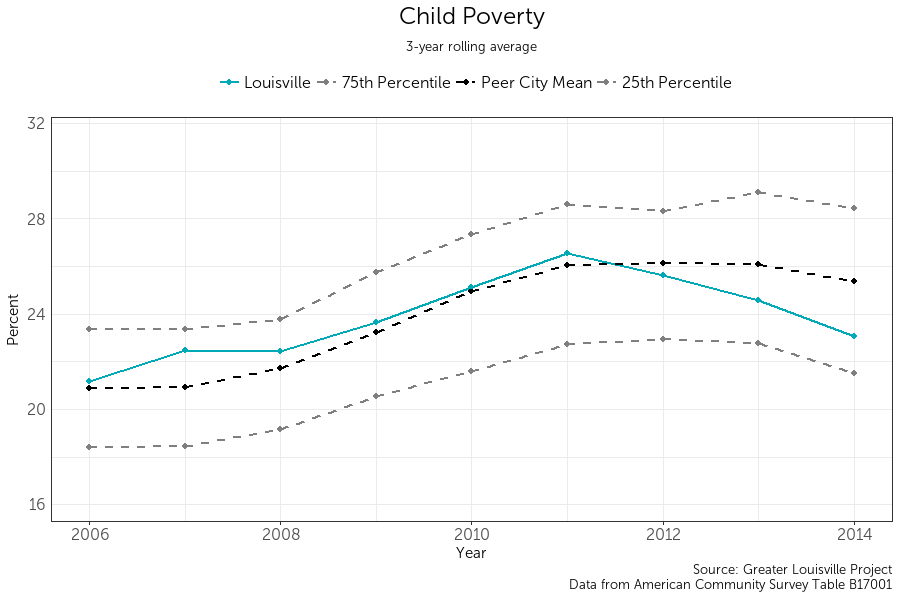
Child Poverty
Young children living in poverty experience unique barriers to food access, stable housing, healthcare, and social support. In addition, they are at an increased risk of depression, intimate partner violence, and poor health behaviors as they grow older. As a result, children who grow up in poverty experience higher rates of illness and death than children who do not.
Peer City Perspective
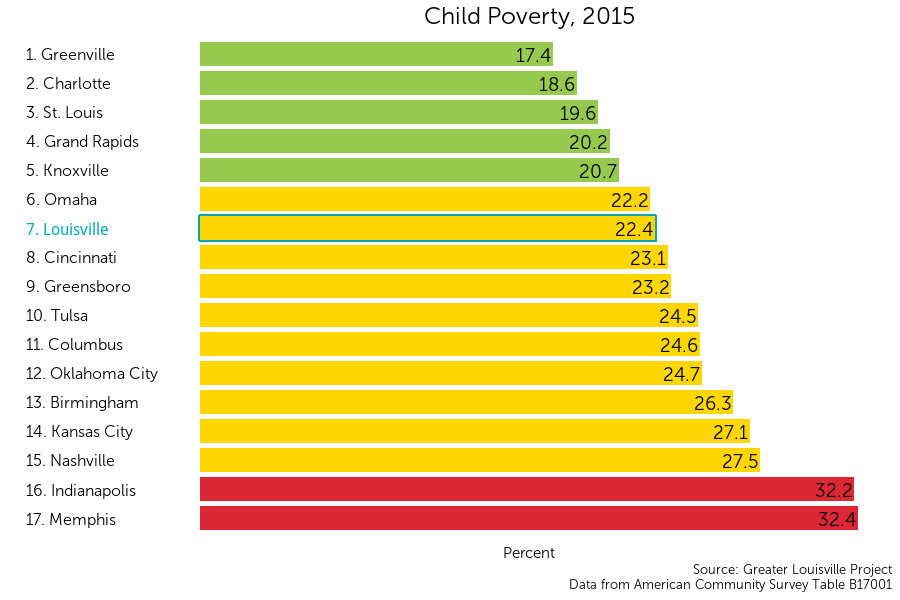
Louisville currently ranks 7th among its peer cities with 22.4 percent of children under the age of 18 living in poverty. The poverty line in 2015 was $15,930 for a family of two and $20,090 for a family of three.
Louisville is in the middle of its peer group according to a natural breaks algorithm. Cities in Green are a cluster that outperforms their peers, Yellow represents the middle cluster, and Red is a group that lags behind its peers on this indicator.
Where is childhood poverty found in Louisville?
Although Louisville ranks 7th out of 17 cities in child poverty rates, child poverty varies substantially within the city, ranging from 67% in some neighborhoods to 4% in others. In the map to the left, areas with higher rates of child poverty are purple, and areas with lower rates are white.
Child poverty is most concentrated in Louisville’s western and downtown neighborhoods. Russell, California, Smoketown, and Park Hill are several neighborhoods with particularly high rates of child poverty. The lowest rates of child poverty are in Floyd’s Fork, the Highlands, and Northeast Jefferson.
Scroll over the map to see values for each census tract. Zoom in to see street names that form the boundaries of each tract.
Trends Over Time
The child poverty rate in Louisville has been steadily decreasing since 2011. Until then, Louisville traditionally ranked in the bottom 50% of its peer cities. However, Louisville has been reducing child poverty at a faster rate than many of its peer cities over the past 5 years, and it is now ranked just outside the top 25% of its peer cities. Concerted efforts to eradicate child poverty could create a foundation that would place Louisville in the top tier of cities for generations to come.
Continue Exploring with Related Data
Social Associations
Strong and supportive social networks help residents to be resilient during difficult times. Social associations are a useful proxy for social capital, networks of relationships and trust among people in a community. Social capital is a particularly important resource for people living in multidimensional poverty who have limited access to many other resources. Social connections can help those in poverty find solutions for the problems they face obtaining transportation, child care, and housing.
Peer City Perspective
Louisville currently ranks 14th among its peer cities with approximately 10 associations per 10,000 residents.
Louisville is in the bottom tier of its peer group according to a natural breaks algorithm. Cities in green are those that outperform their peers, cities in yellow represent the middle cluster, and those in red are a group that lags behind its peers on this indicator.


Trends Over Time
The rate of social associations relative to the population in Louisville was steadily decreasing from 2000 to 2011 but has remained relatively constant between 2011 and 2017. This decreasing trend is similar to the overall trend observed in Louisville’s peer cities, although Louisville has fallen below the 25th percentile of its peers.
Comparison between the Most and Least Improved Peer Cities
Since 2000, Grand Rapids saw its number of membership organizations remain constant, while the number of membership associations in Greensboro decreased greatly.

Continue Exploring with Related Data
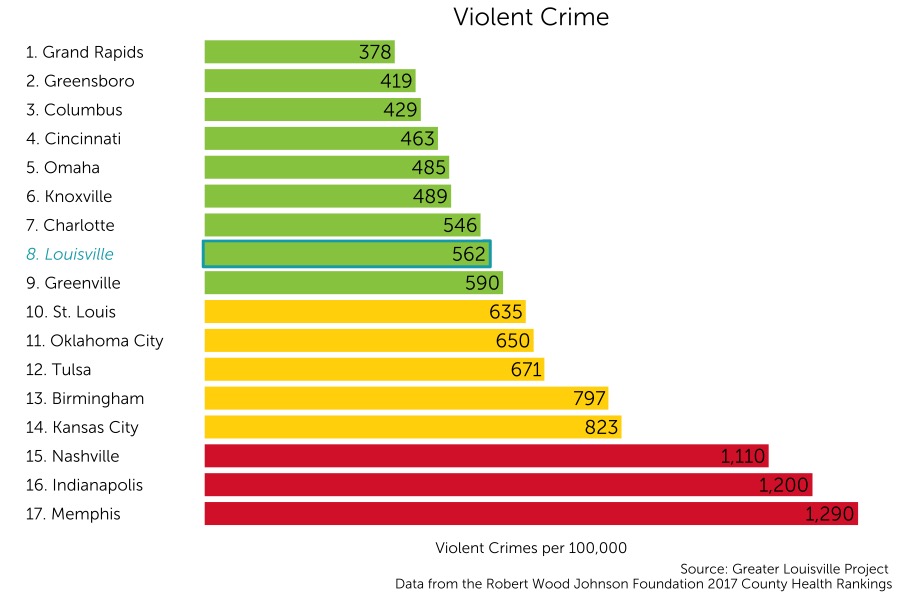
Violent Crime
While violent crime has serious and immediate impacts on its victims, its effects permeate through the whole community. Violent crime is harmful to mental health, it deters people from healthy behaviors like outdoor exercise, and it is detrimental to community-building. Violent crime is a result of a wide variety of factors, including poverty and household instability.
Peer City Perspective
Louisville currently ranks 8th among its peer cities with 562.5 violent crimes per year per 100,000 people.
Louisville is in the top tier of its peer group according to a natural breaks algorithm. Cities in green are those that outperform their peers, cities in yellow represent the middle cluster, and those in red are a group that lags behind its peers on this indicator.
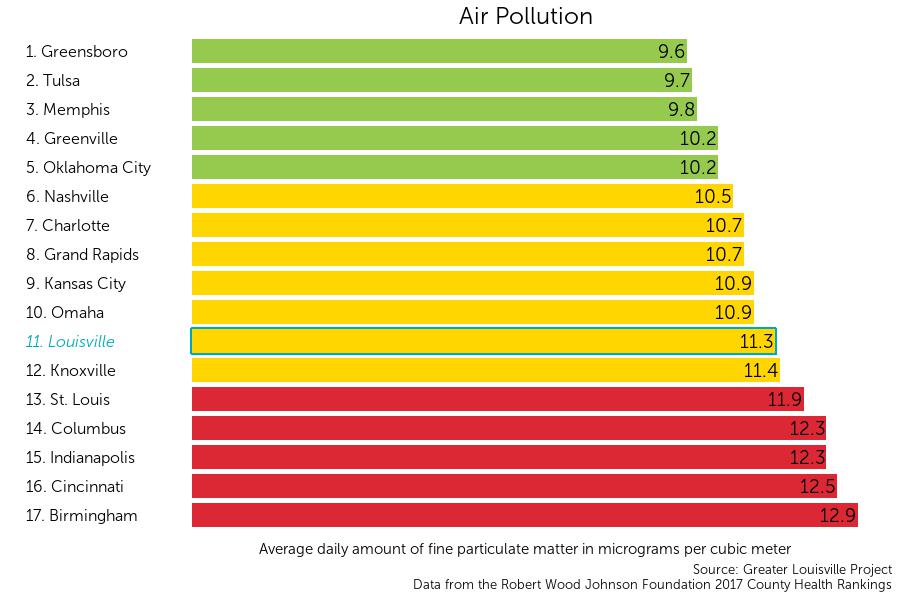
Air Pollution
Air pollution is an important facet of the natural environment and its impact on the health of a community. Research has indicated higher asthma rates in areas with higher air pollutant particulates, and for poorer communities this can have a devastating impact as it entails higher health costs.
Peer City Perspective
Louisville currently ranks 11th among its peer cities in air quality, a measure of the daily amount of fine particulates in micrograms per cubic meter, with 11.3 micrograms per cubic meter.
On this metric, Louisville is in the middle tier of its peer group according to a natural breaks algorithm. Cities in green are those that outperform their peers, cities in yellow represent the middle cluster, and those in red are a group that lags behind its peers on this indicator.
Continue Exploring with Related Data
Commute Time
Long commutes to work can decrease access to community resources and may indicate major barriers to economic agility. Increased commuting times can introduce intense pressure on time management and limit temporal flexibility, making it difficult to respond quickly to life stresses.
Peer City Perspective
Louisville currently ranks 8th among its peer cities in percentage of people with a commute longer than 30 minutes. Approximately 24.7% of Louisvillians experience a long commute.
On this metric, Louisville is in the middle tier of its peer group according to a natural breaks algorithm. Cities in green are those that outperform their peers, cities in yellow represent the middle cluster, and those in red are a group that lags behind its peers on this indicator.


Trends Over Time
Since 2009, the average commute time in Louisville has increased by approximately one minute. Louisville’s average driving commute time has increased relative to its peers since 2009 but still remains lower than its peer city average.
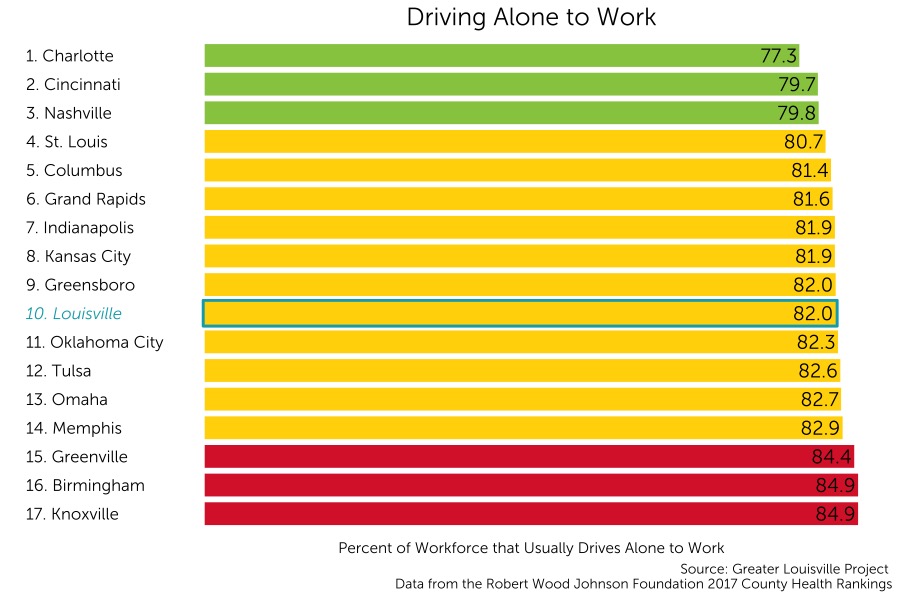
Driving Alone to Work
Driving alone to work can increase traffic and serves as an indicator of the amount of resources that a given community has access to, which can be a significant barrier to economic agility. Driving alone to work is also a significant driver of negative environmental impacts.
Peer City Perspective
Louisville currently ranks 10th among its peer cities in percentage of people driving alone to work with approximately 82% of people driving alone to work.
Louisville is in the middle tier of its peer group according to a natural breaks algorithm. Cities in green are those that outperform their peers, cities in yellow represent the middle cluster, and those in red are a group that lags behind its peers on this indicator.
Severe Housing Problems
Housing is a critical need for all individuals, and affordable housing is a good indicator of the job market and access to quality jobs within a community. Overcrowding, poor facilities, and homelessness exacerbate the experience of multidimensional poverty and increase risks for disease, depression, and transient housing experience. Ultimately, severe housing problems can lead to homelessness and increased housing vacancies, which can result in an increased economic burden on a community and a decreased quality of life for those affected.
Peer City Perspective
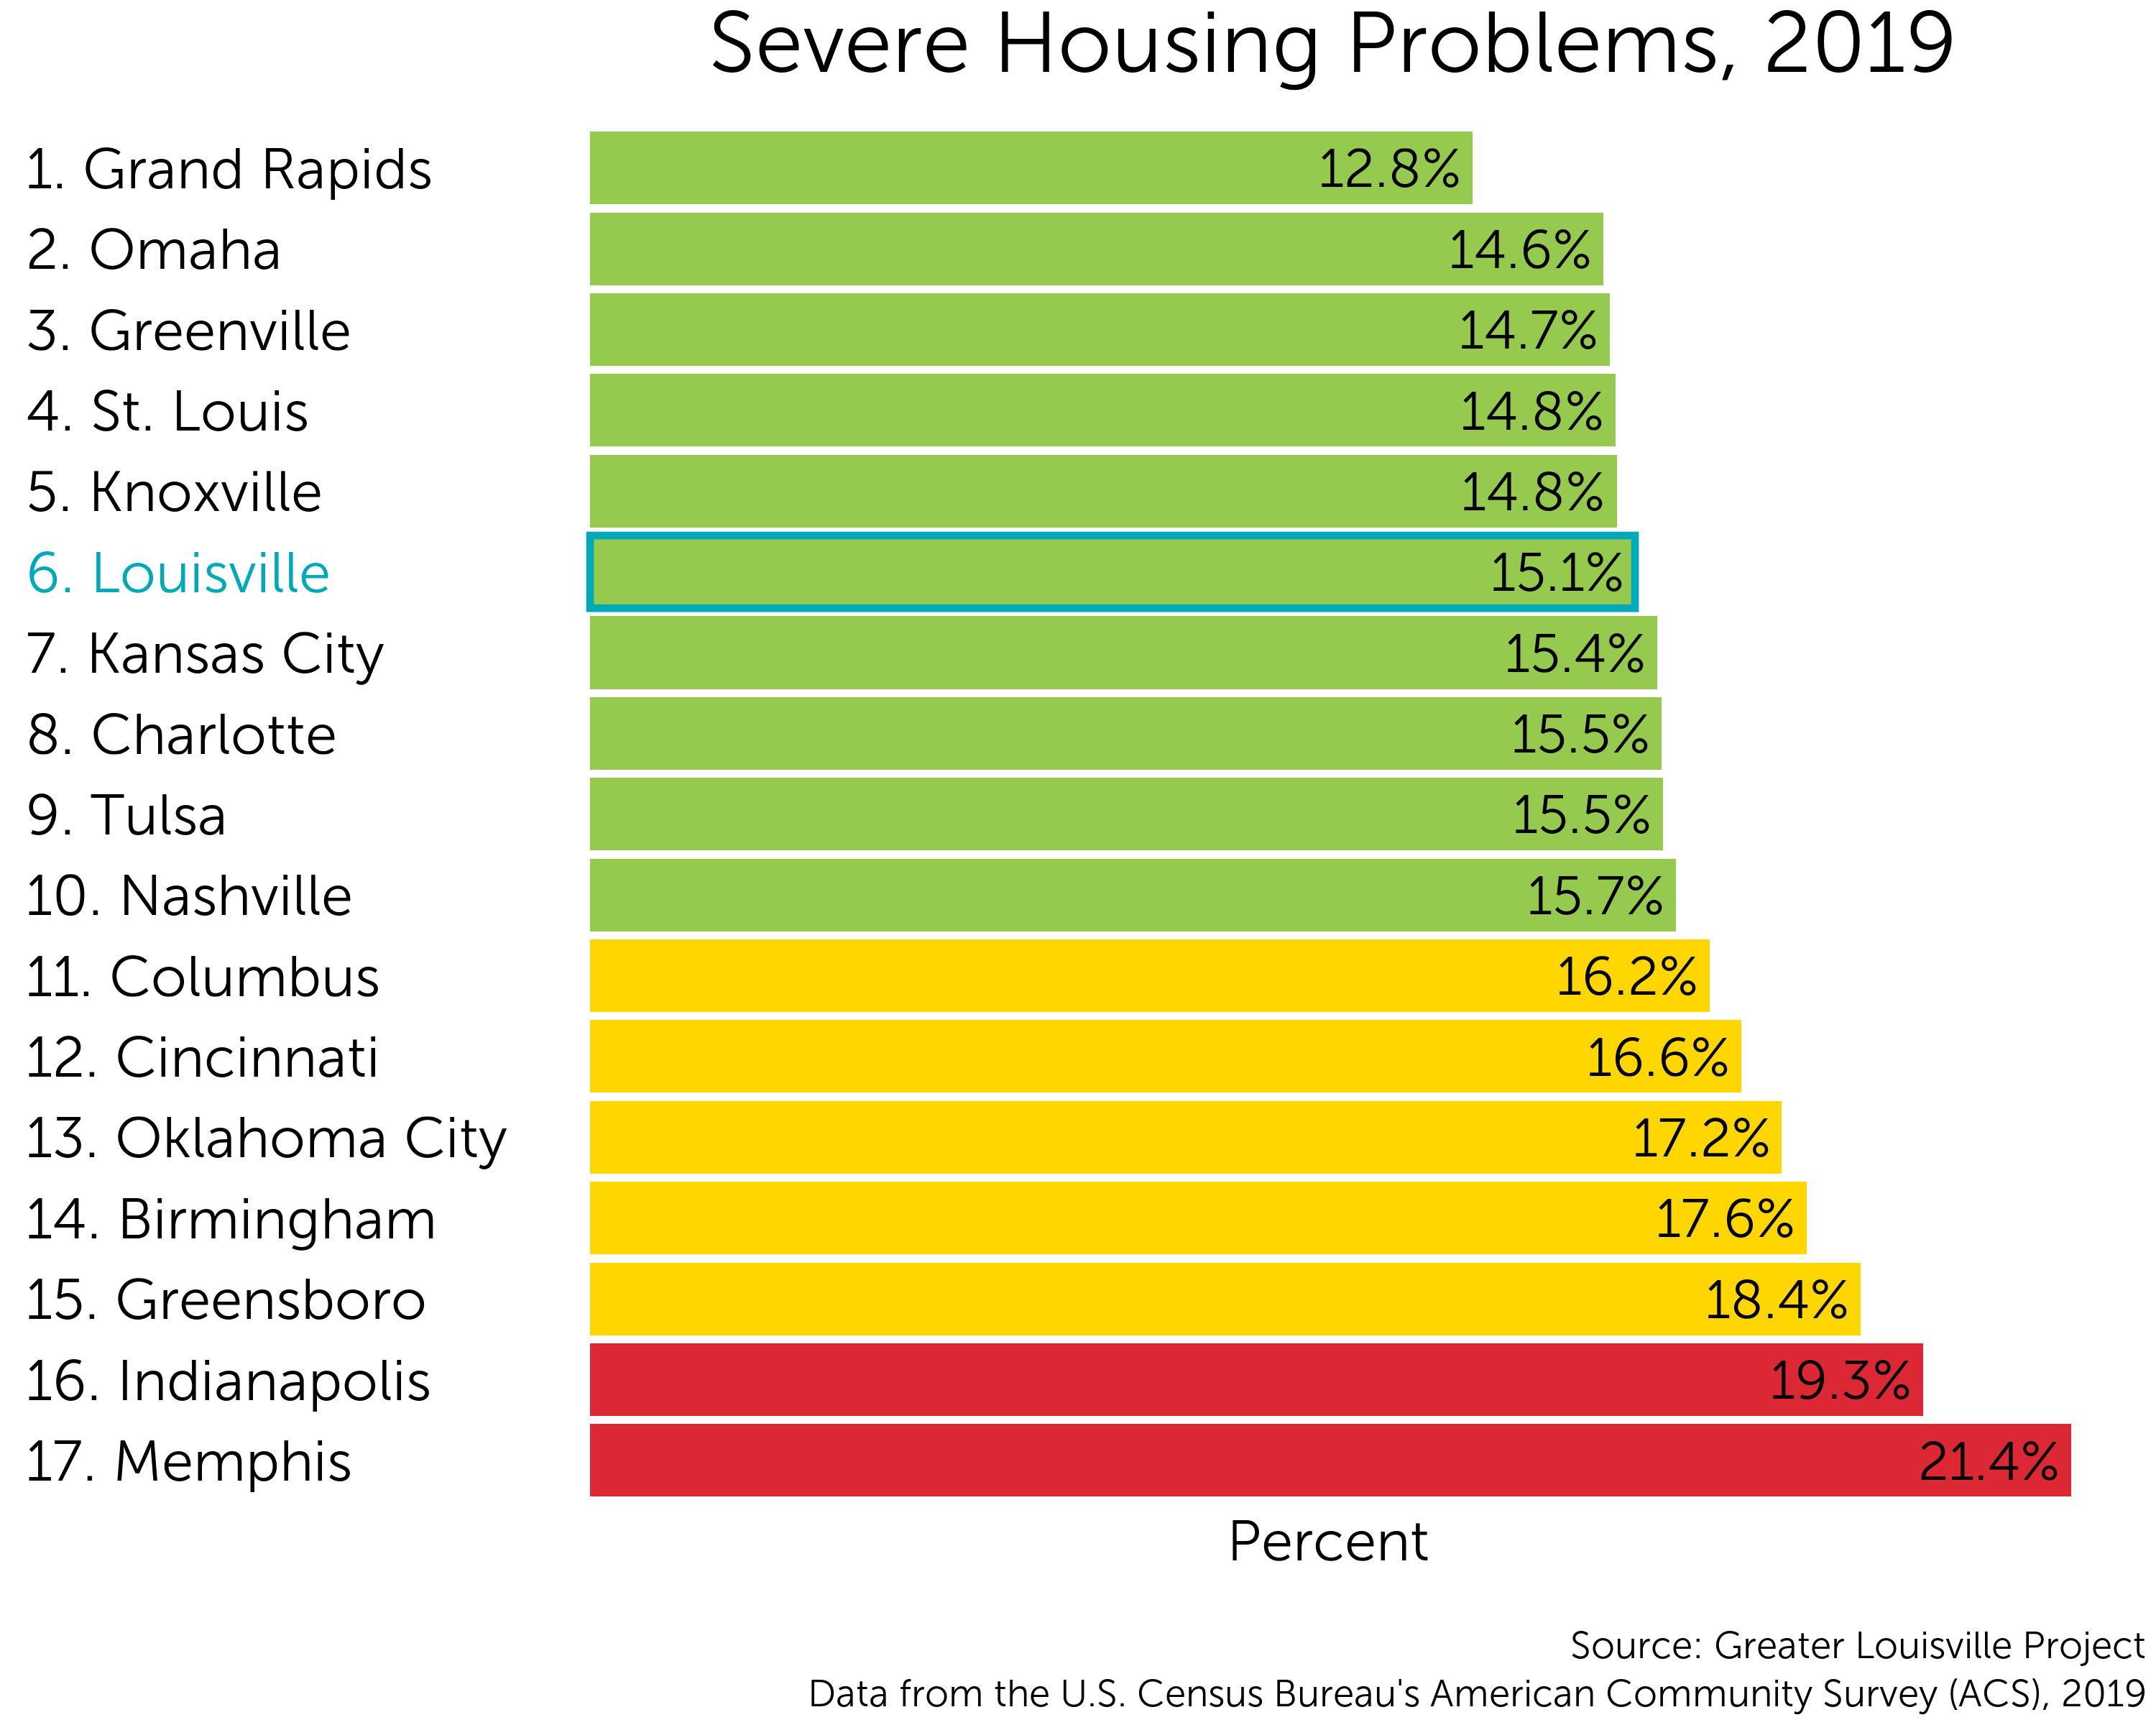
Louisville currently ranks 6th among its peer cities in the percentage of households experiencing severe housing problems.
A household experiences severe housing problems if it has at least one of the following issues: lack of kitchen facilities, lack of complete plumbing, overcrowding, or severe cost burden (paying more than half of their income towards housing costs).
Louisville is in the top tier of its peer group according to a natural breaks algorithm. Cities in green are those that outperform their peers. Cities in yellow represent the middle cluster, and those in red lag behind their peers on this indicator.
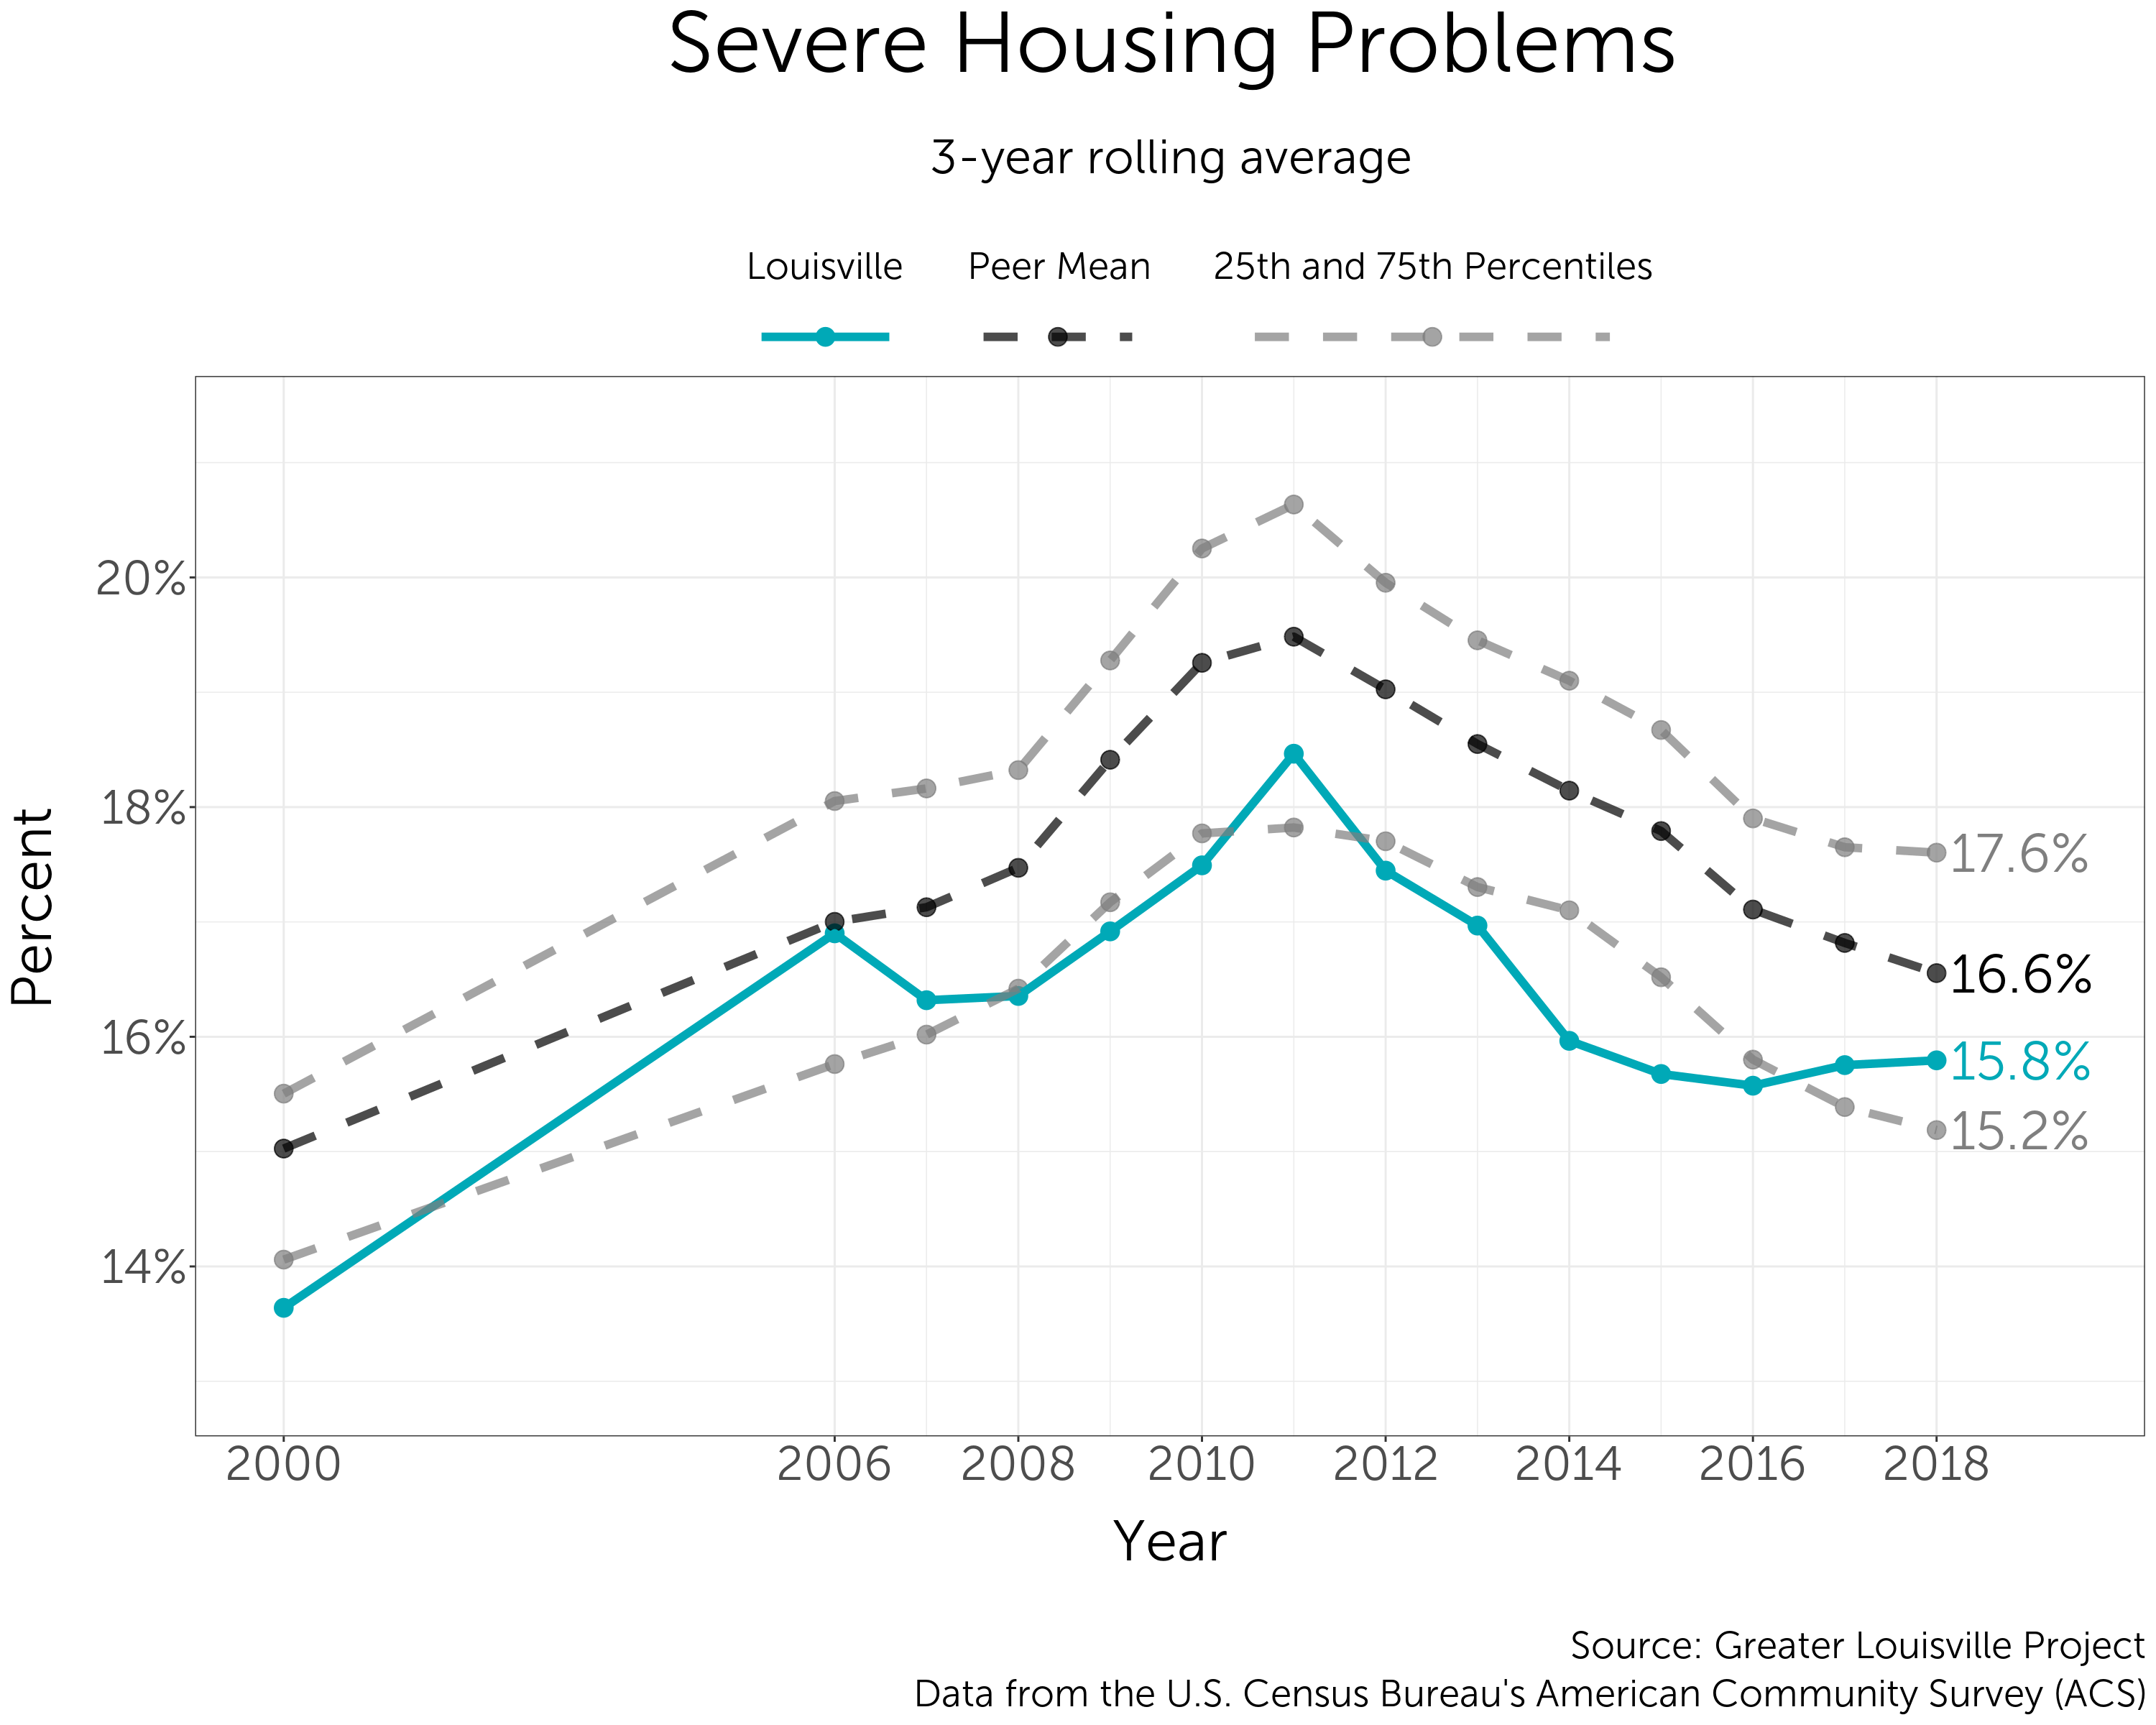
Trends over Time
Fewer Louisville residents experience severe housing problems than residents in peer cities, on average. However, Louisville’s rate of severe housing burden has flattened since 2015 (and might even be increasing slightly), while the rate in peer cities has continued to decrease.
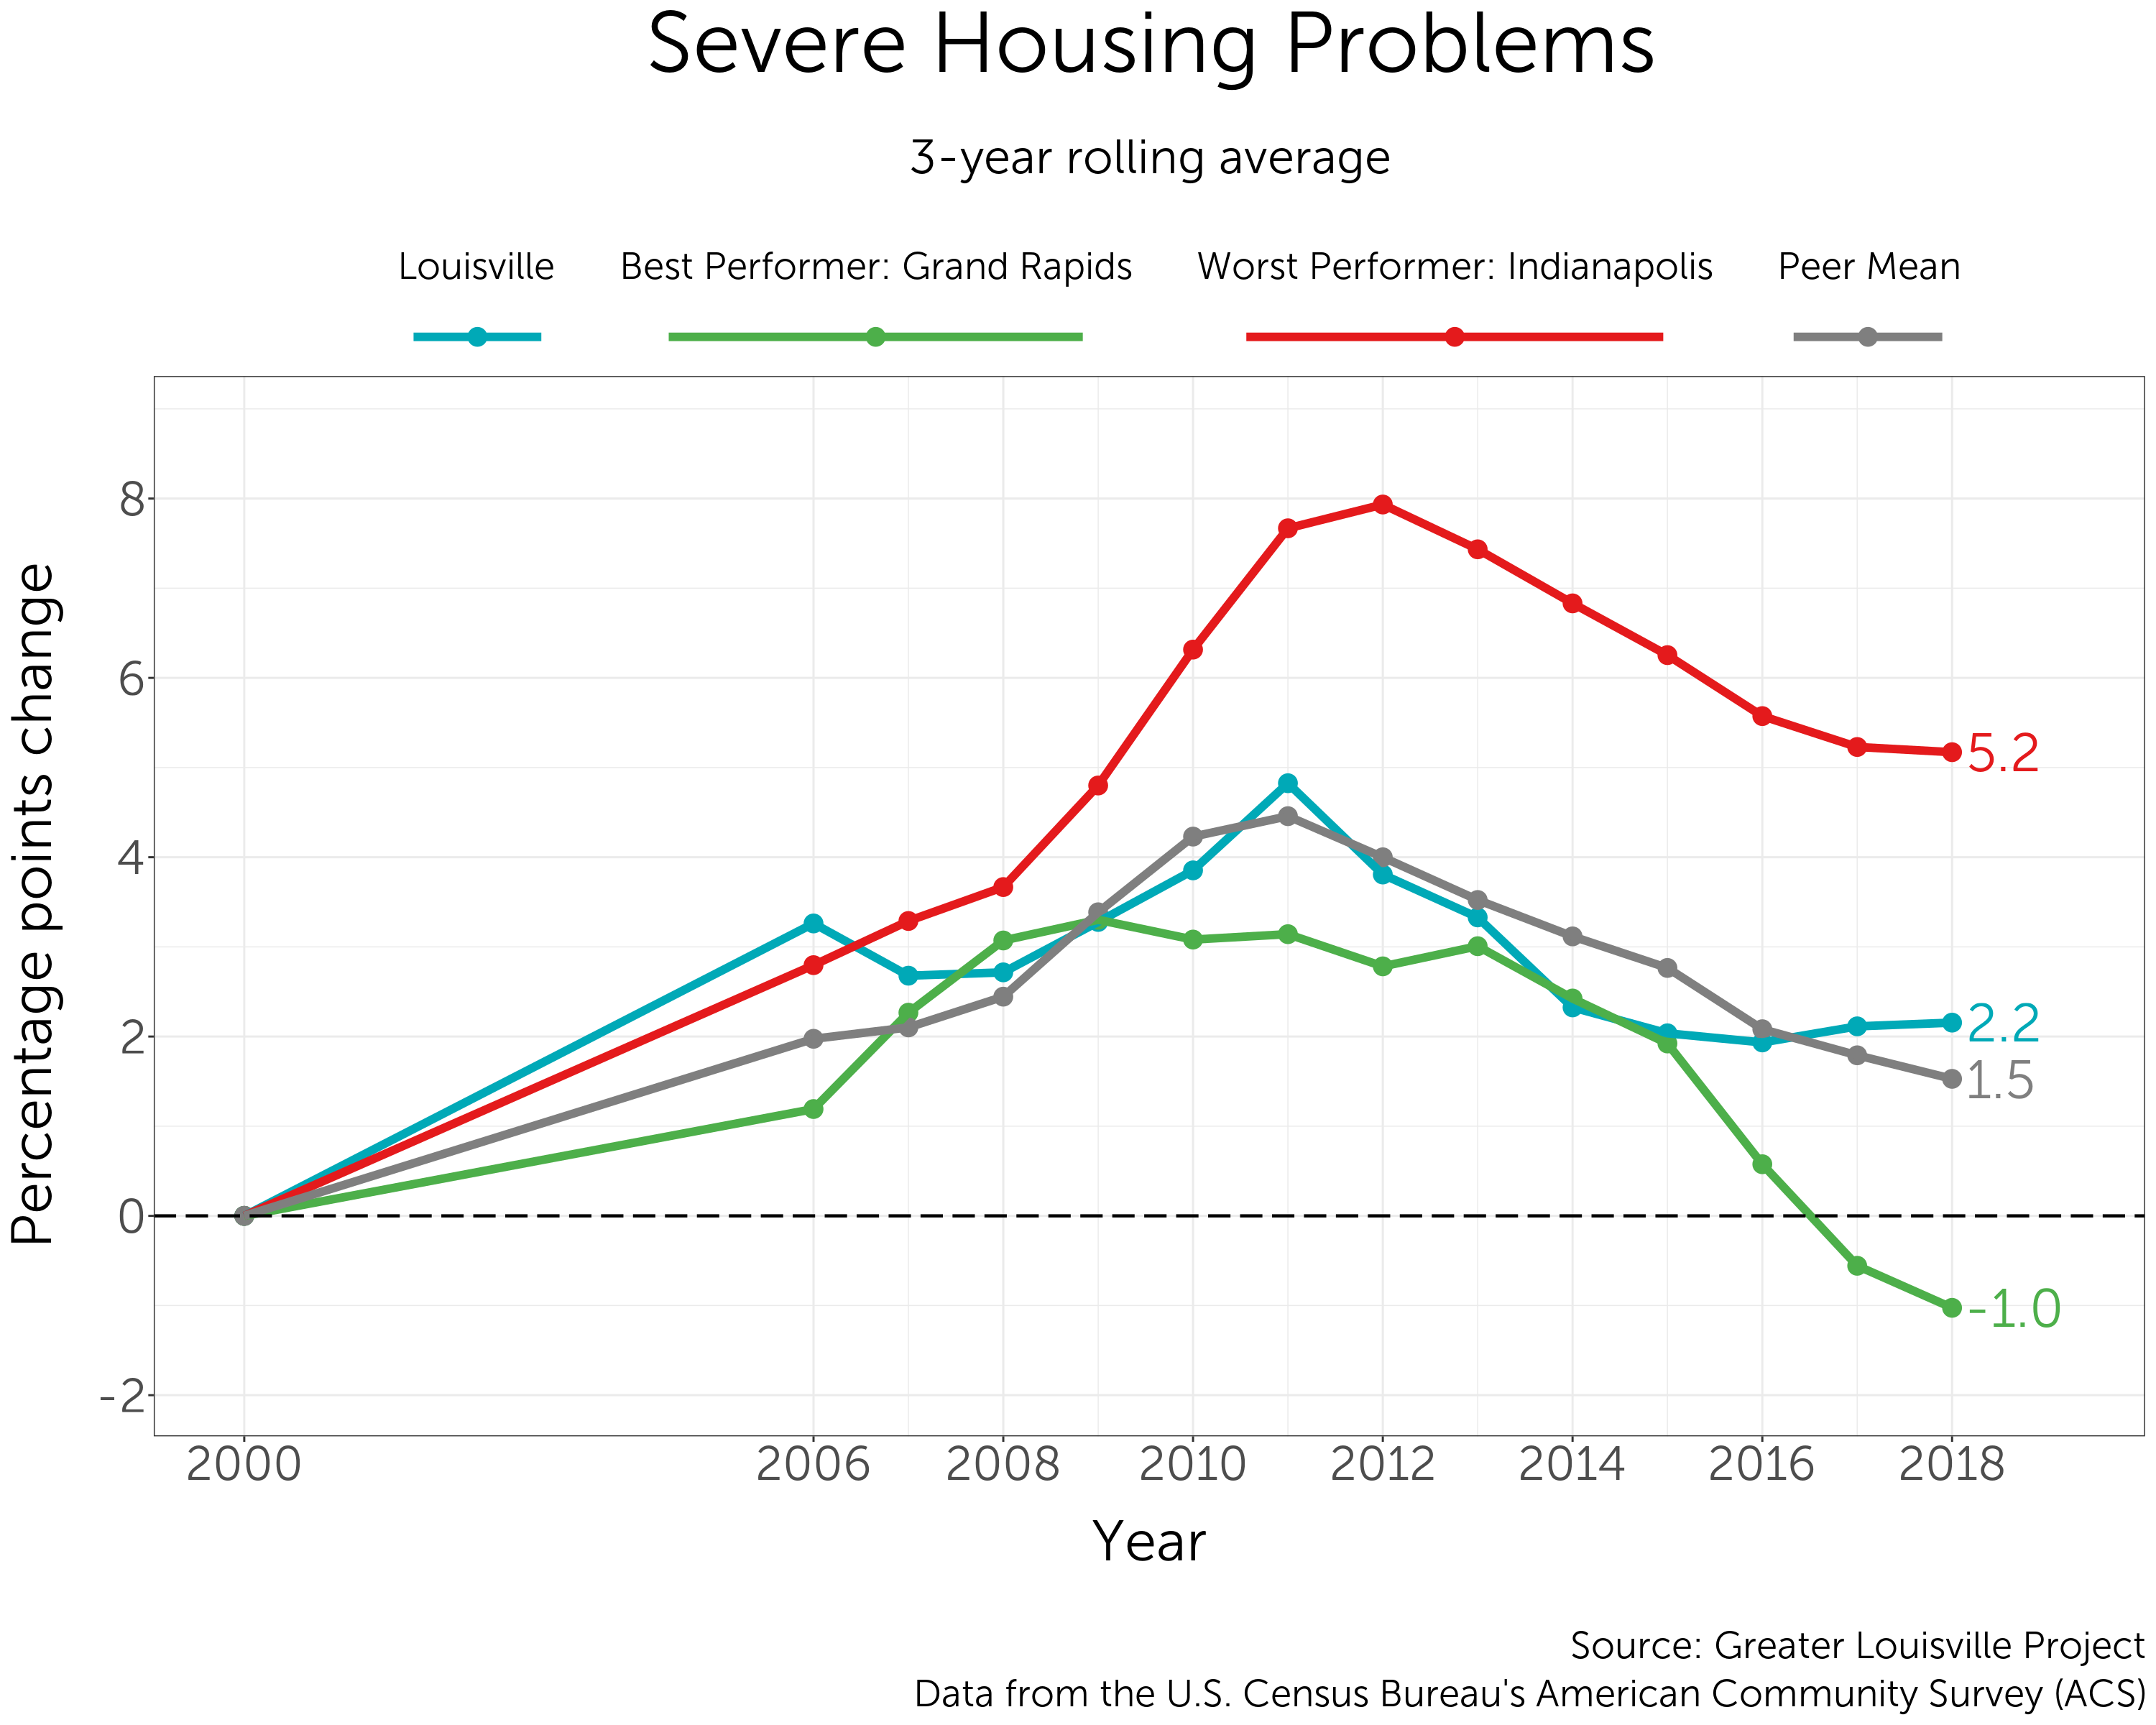
Best and Worst Peer Performers
Over the past two decades, Grand Rapids saw its rate of severe housing burden decrease by 1 percentage point, making it the best performer of the group. In contrast, the rate in Indianapolis increased by more than 5 percentage points, making it the worst performer. Louisville performed slightly worse than its peers, on average, increasing its percentage of households experiencing these severe issues by more than 2 percentage points.
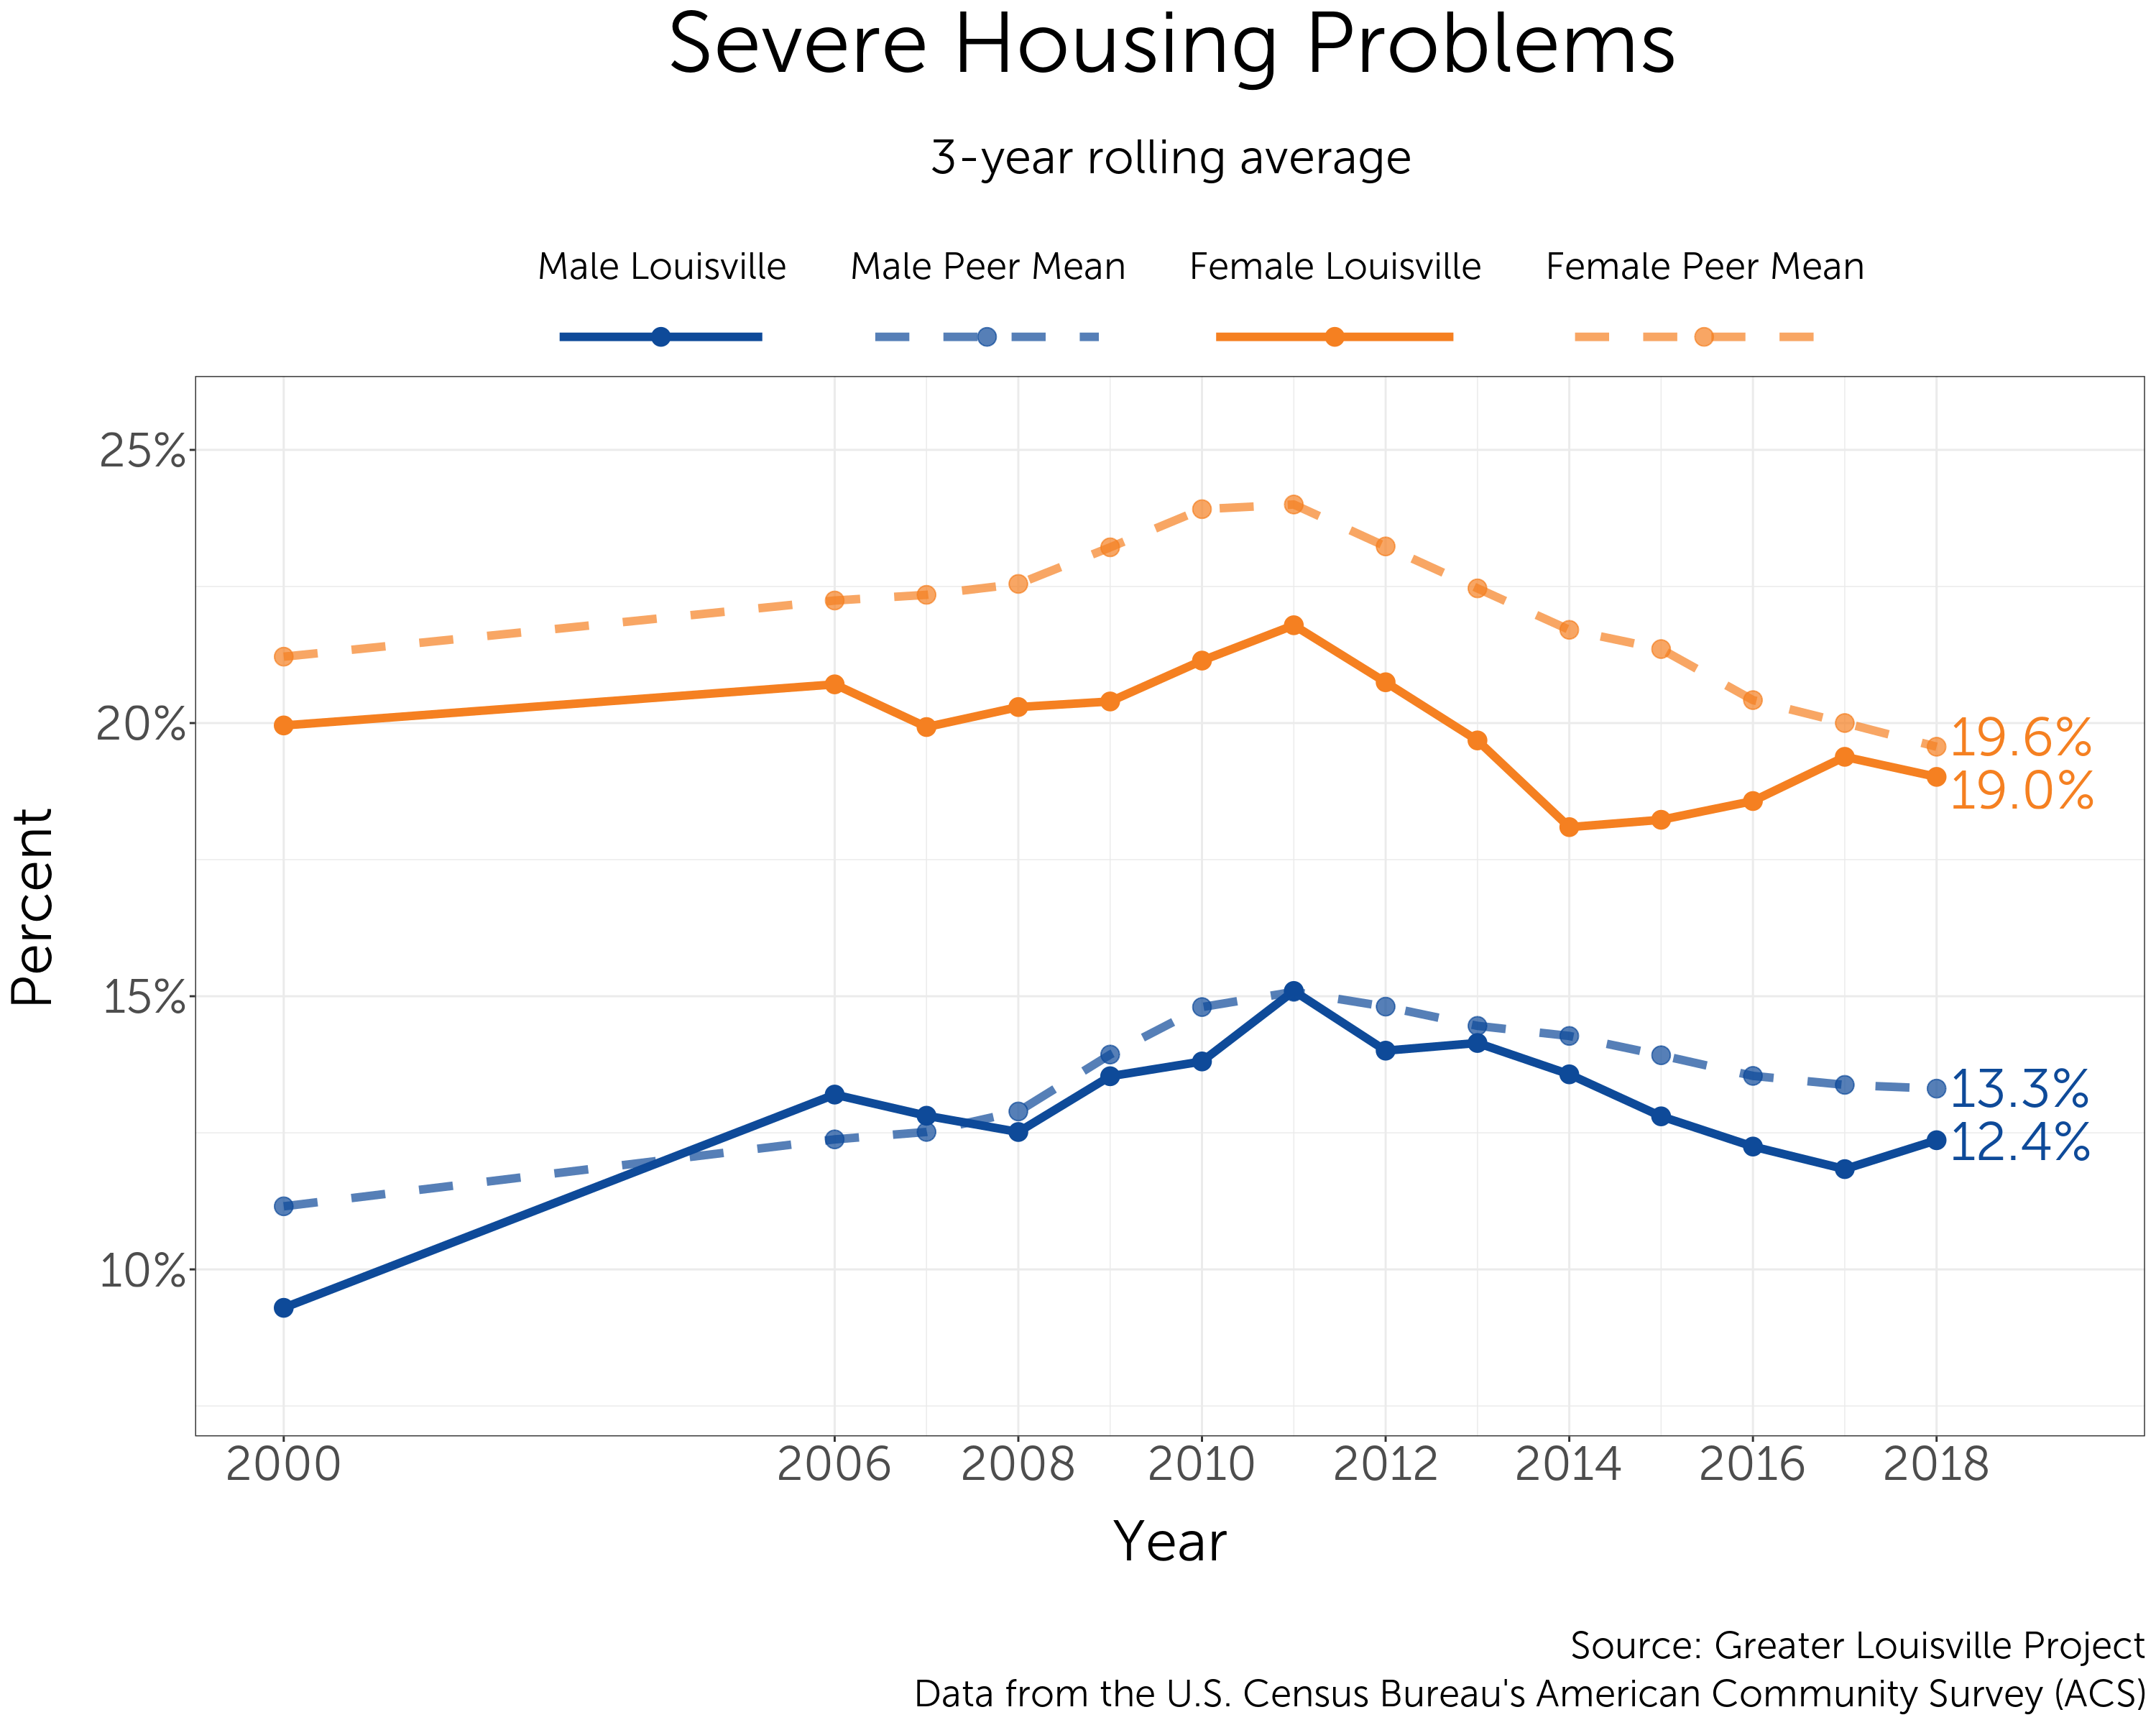
Differences by Sex
In Louisville and across its peer cities, female-headed households experience a higher rate of severe housing burden than male-headed households. While the patterns for each group mirrored each other closely for many years, since 2014, the rate of severe housing burden among female-headed households began to increase, while it continued to decrease among male-headed households.
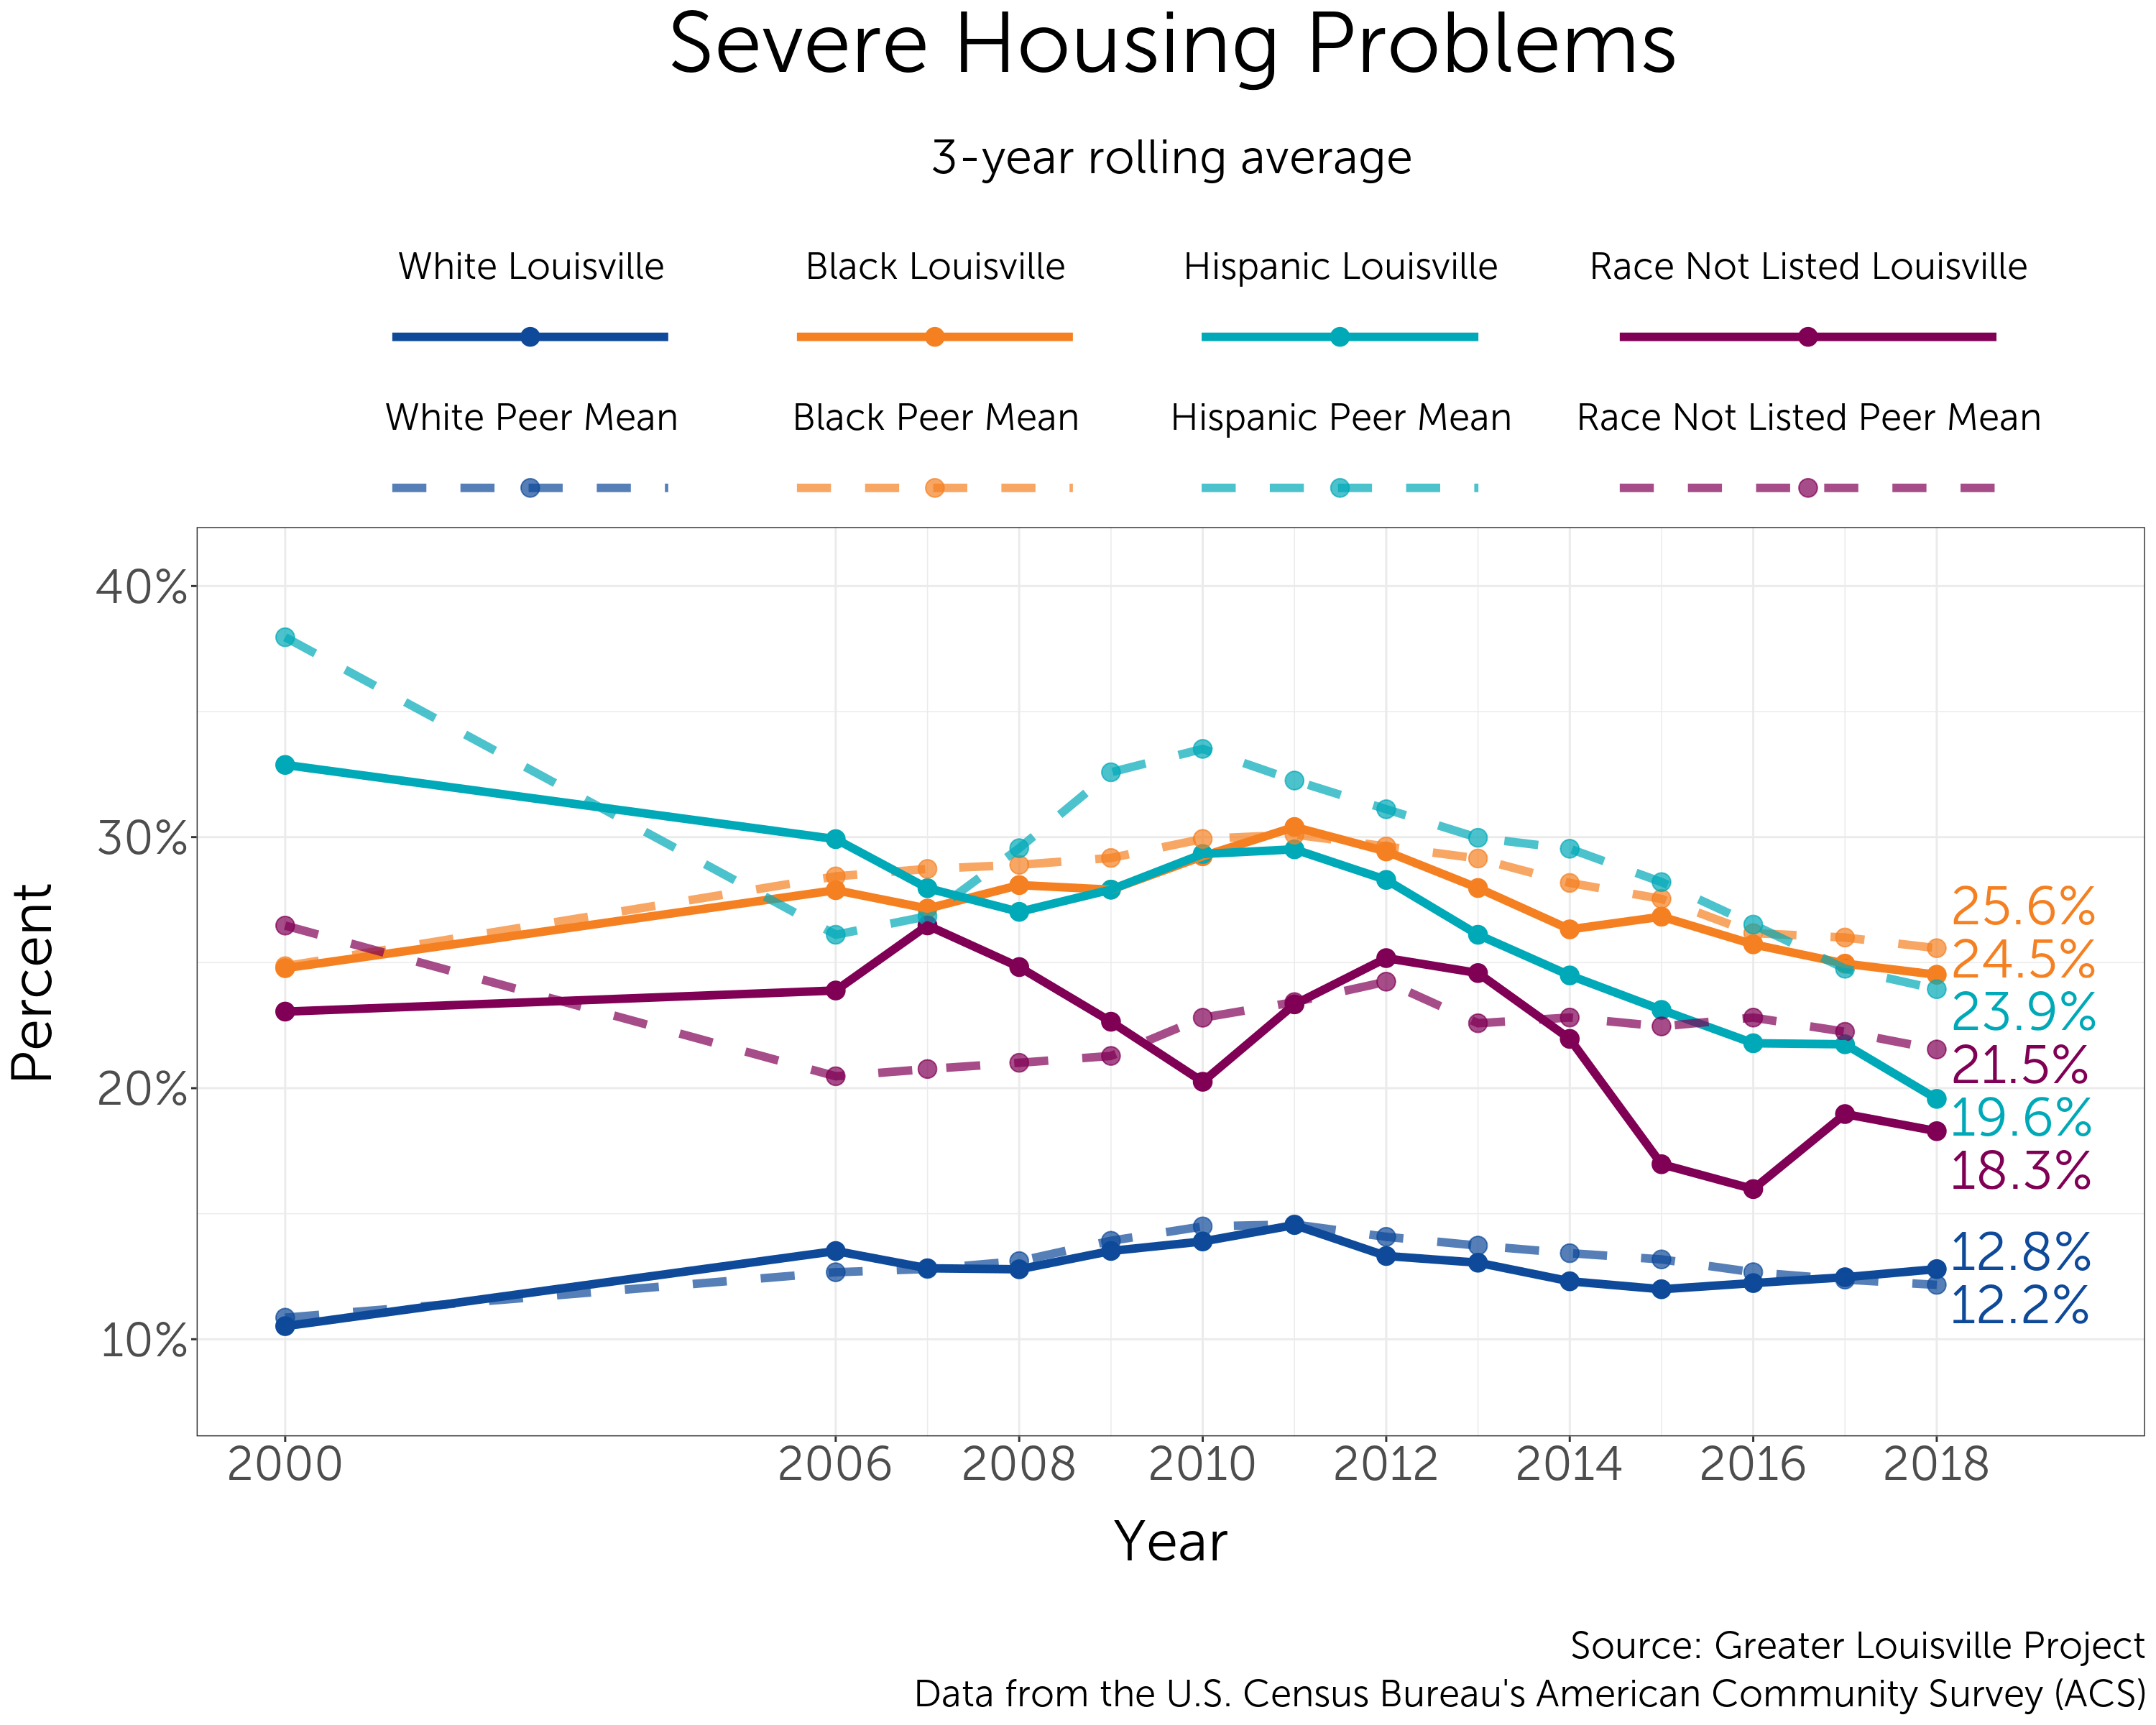
Differences by Race
The rate of severe housing burden among Black households is about twice that of White households in Louisville. Black households have seen somewhat steady improvement on this metric since 2011. Over the past two decades, Hispanic households have seen fairly steady improvement as well. The rate of severe housing burden among Hispanic households now sits at nearly 20%, down from more than 30% in 2000.
Homeownership
Homeownership has been shown to correspond with increased educational achievement, civic participation, and health. Boosting homeownership rates is important because homeowners are typically more invested in their communities and can help ensure that Louisville is a prosperous city for all.
Peer City Perspective
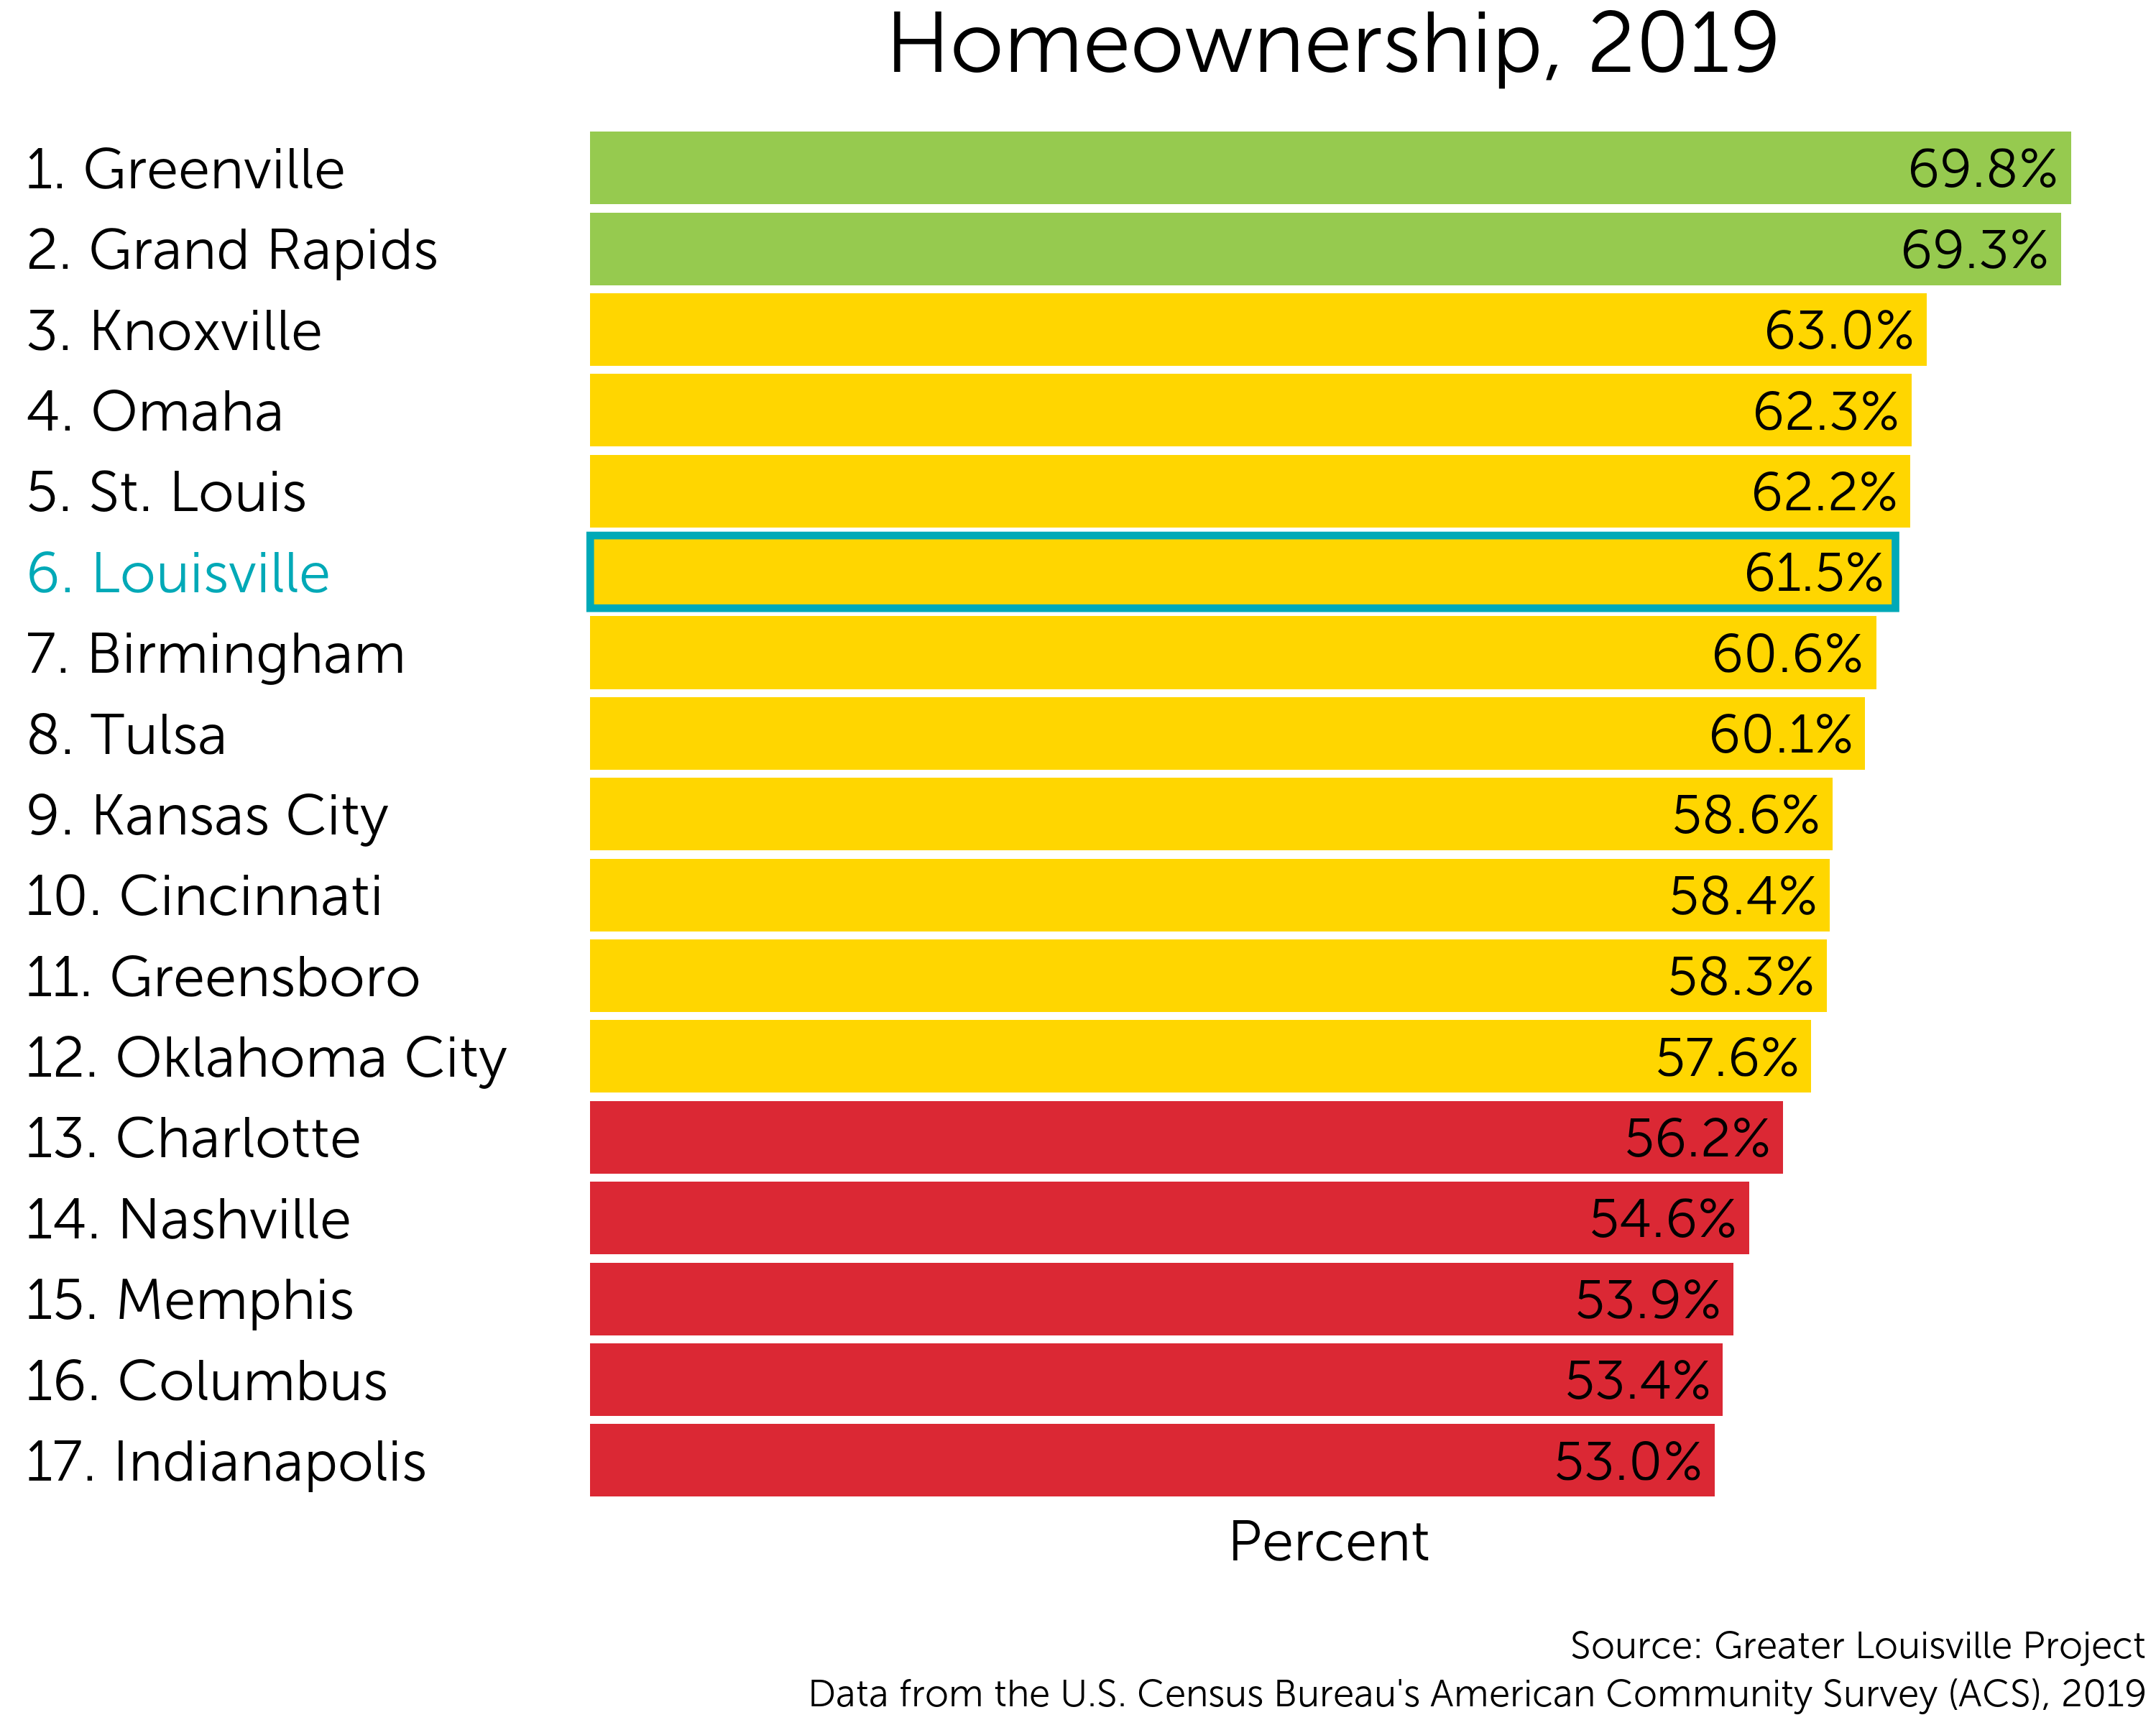
Louisville currently ranks 6th among its peers in the overall percentage of housing units that are owned.
That puts Louisville in the middle tier of its peers according to a natural breaks algorithm. Cities in green are those that outperform their peers. Cities in yellow represent the middle cluster, and those in red lag behind their peers on this indicator.
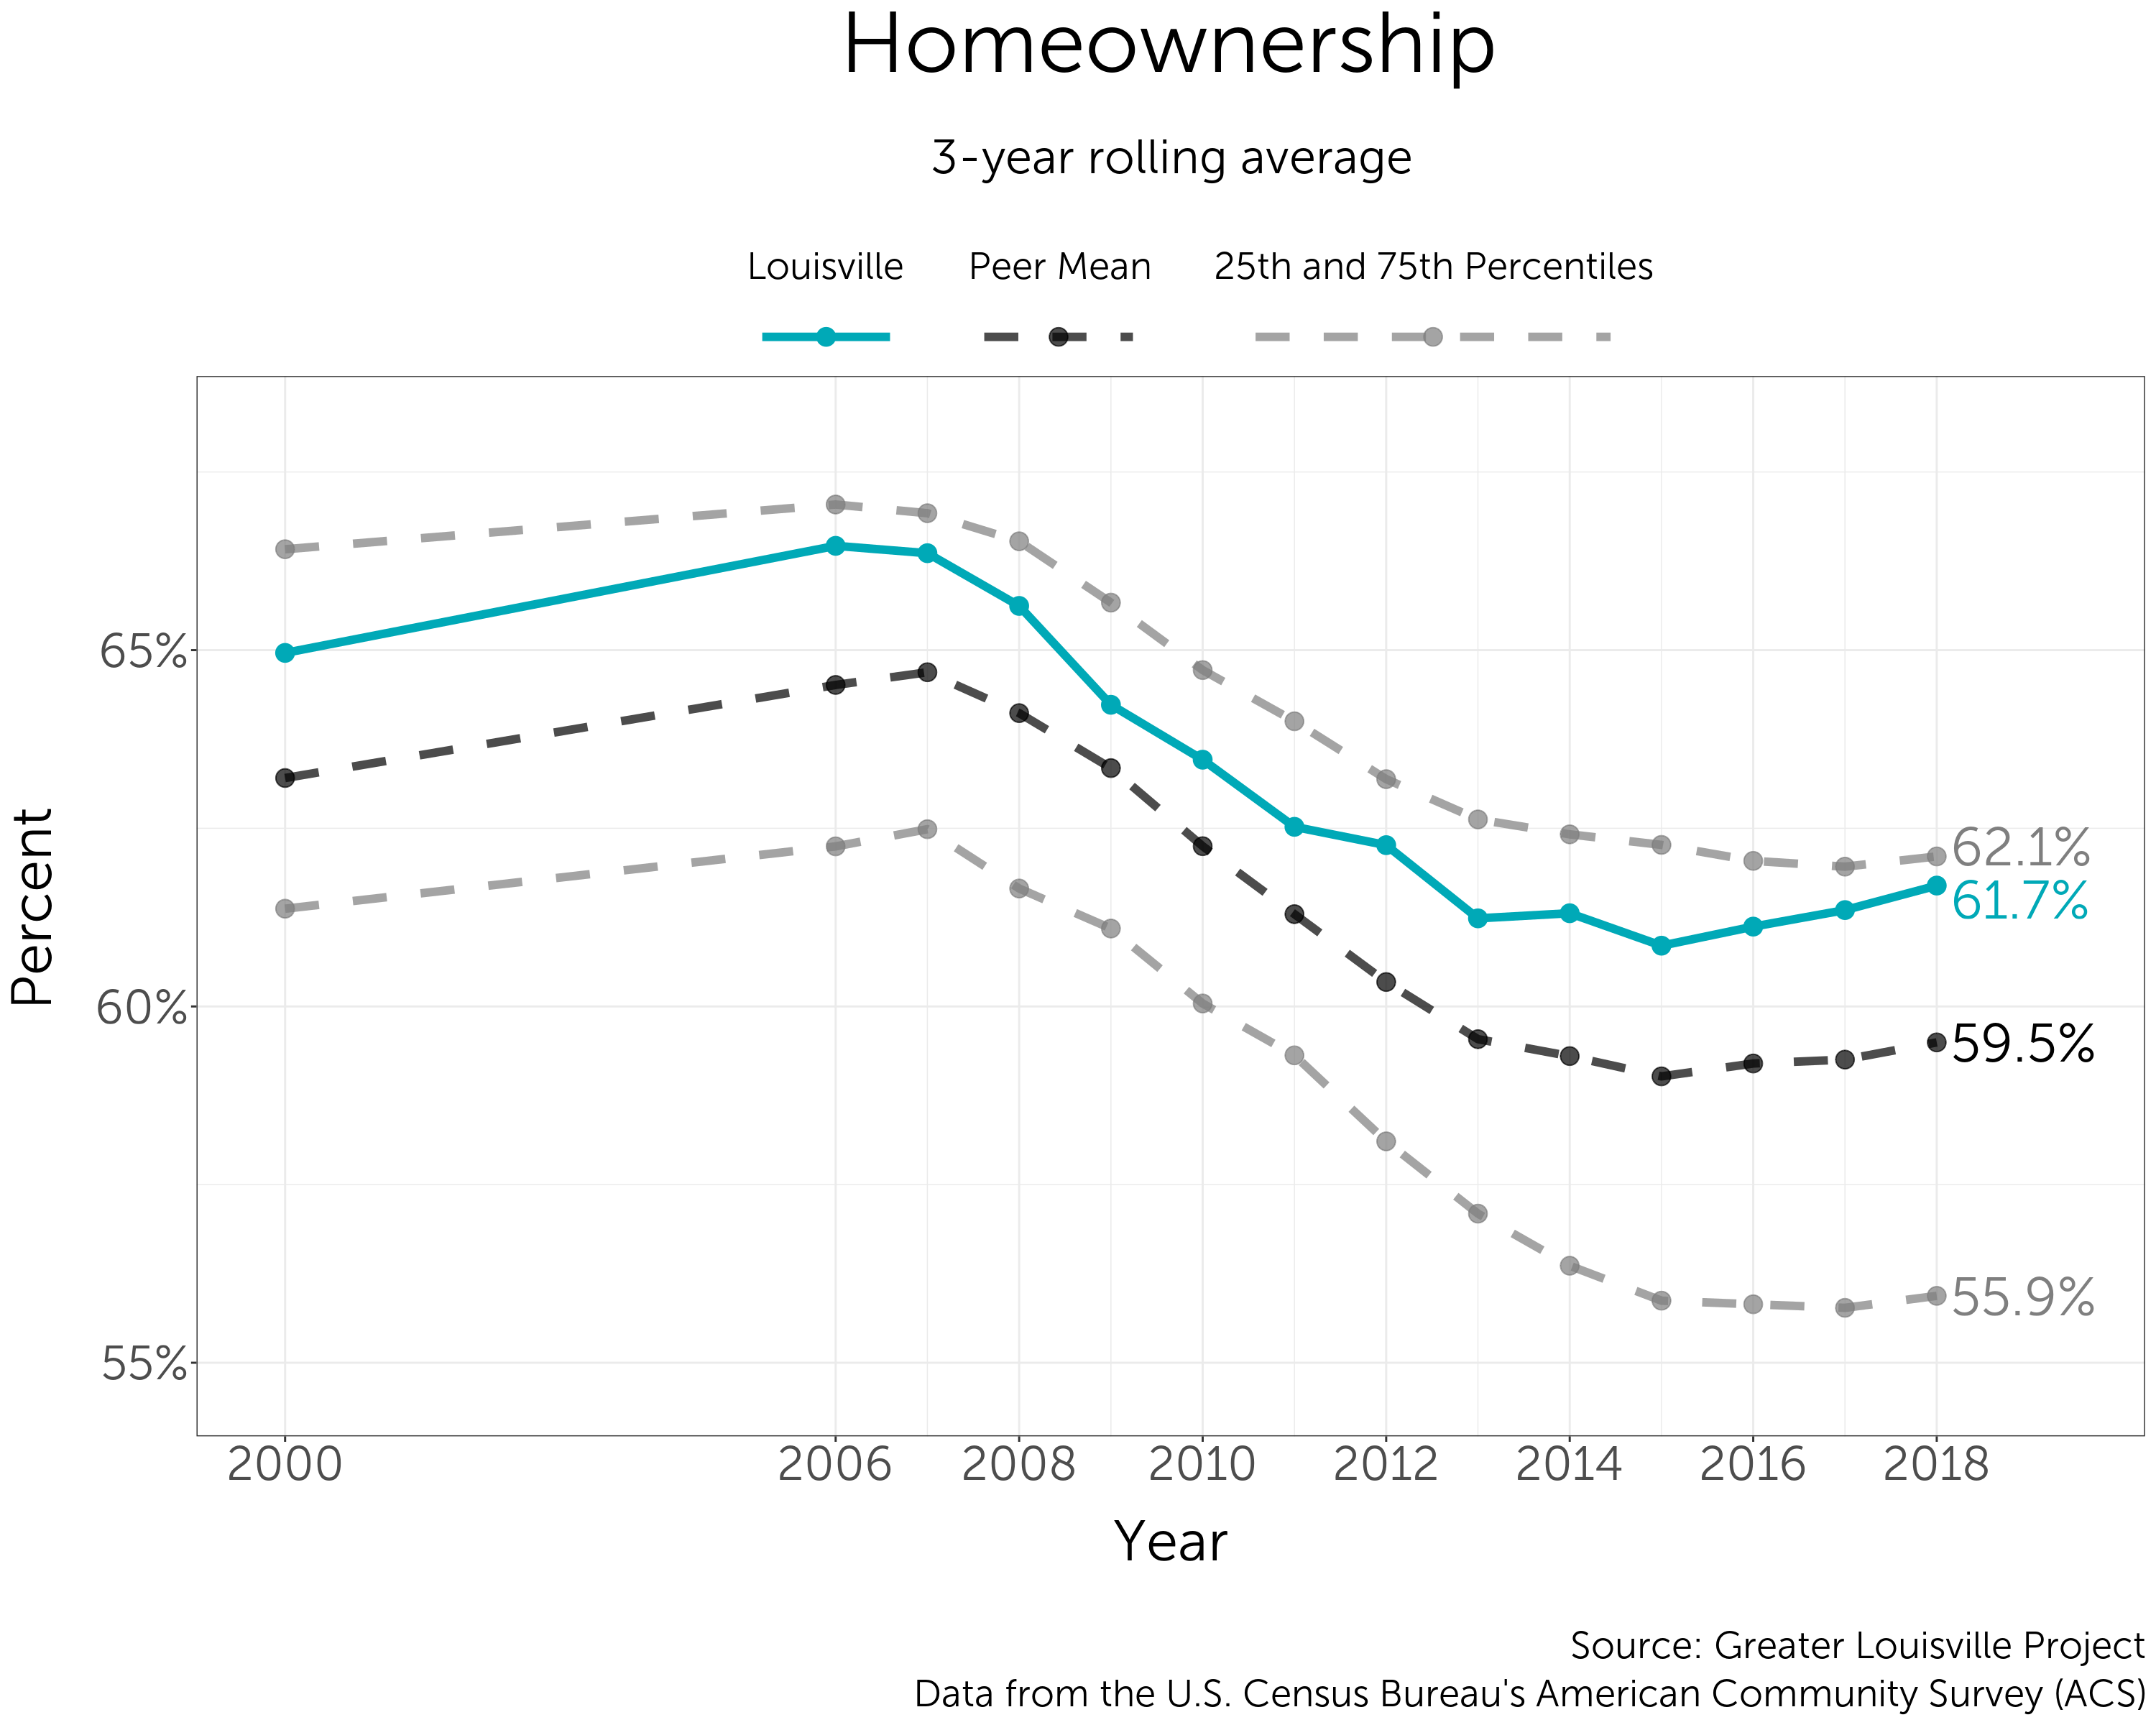
Trends over Time
Homeownership rates appear to be trending upward after they declined significantly in the years following the Great Recession. In Louisville particularly, the homeownership rate has spiked in recent years. It now sits at nearly 62%. That is above the peer average of nearly 60%.
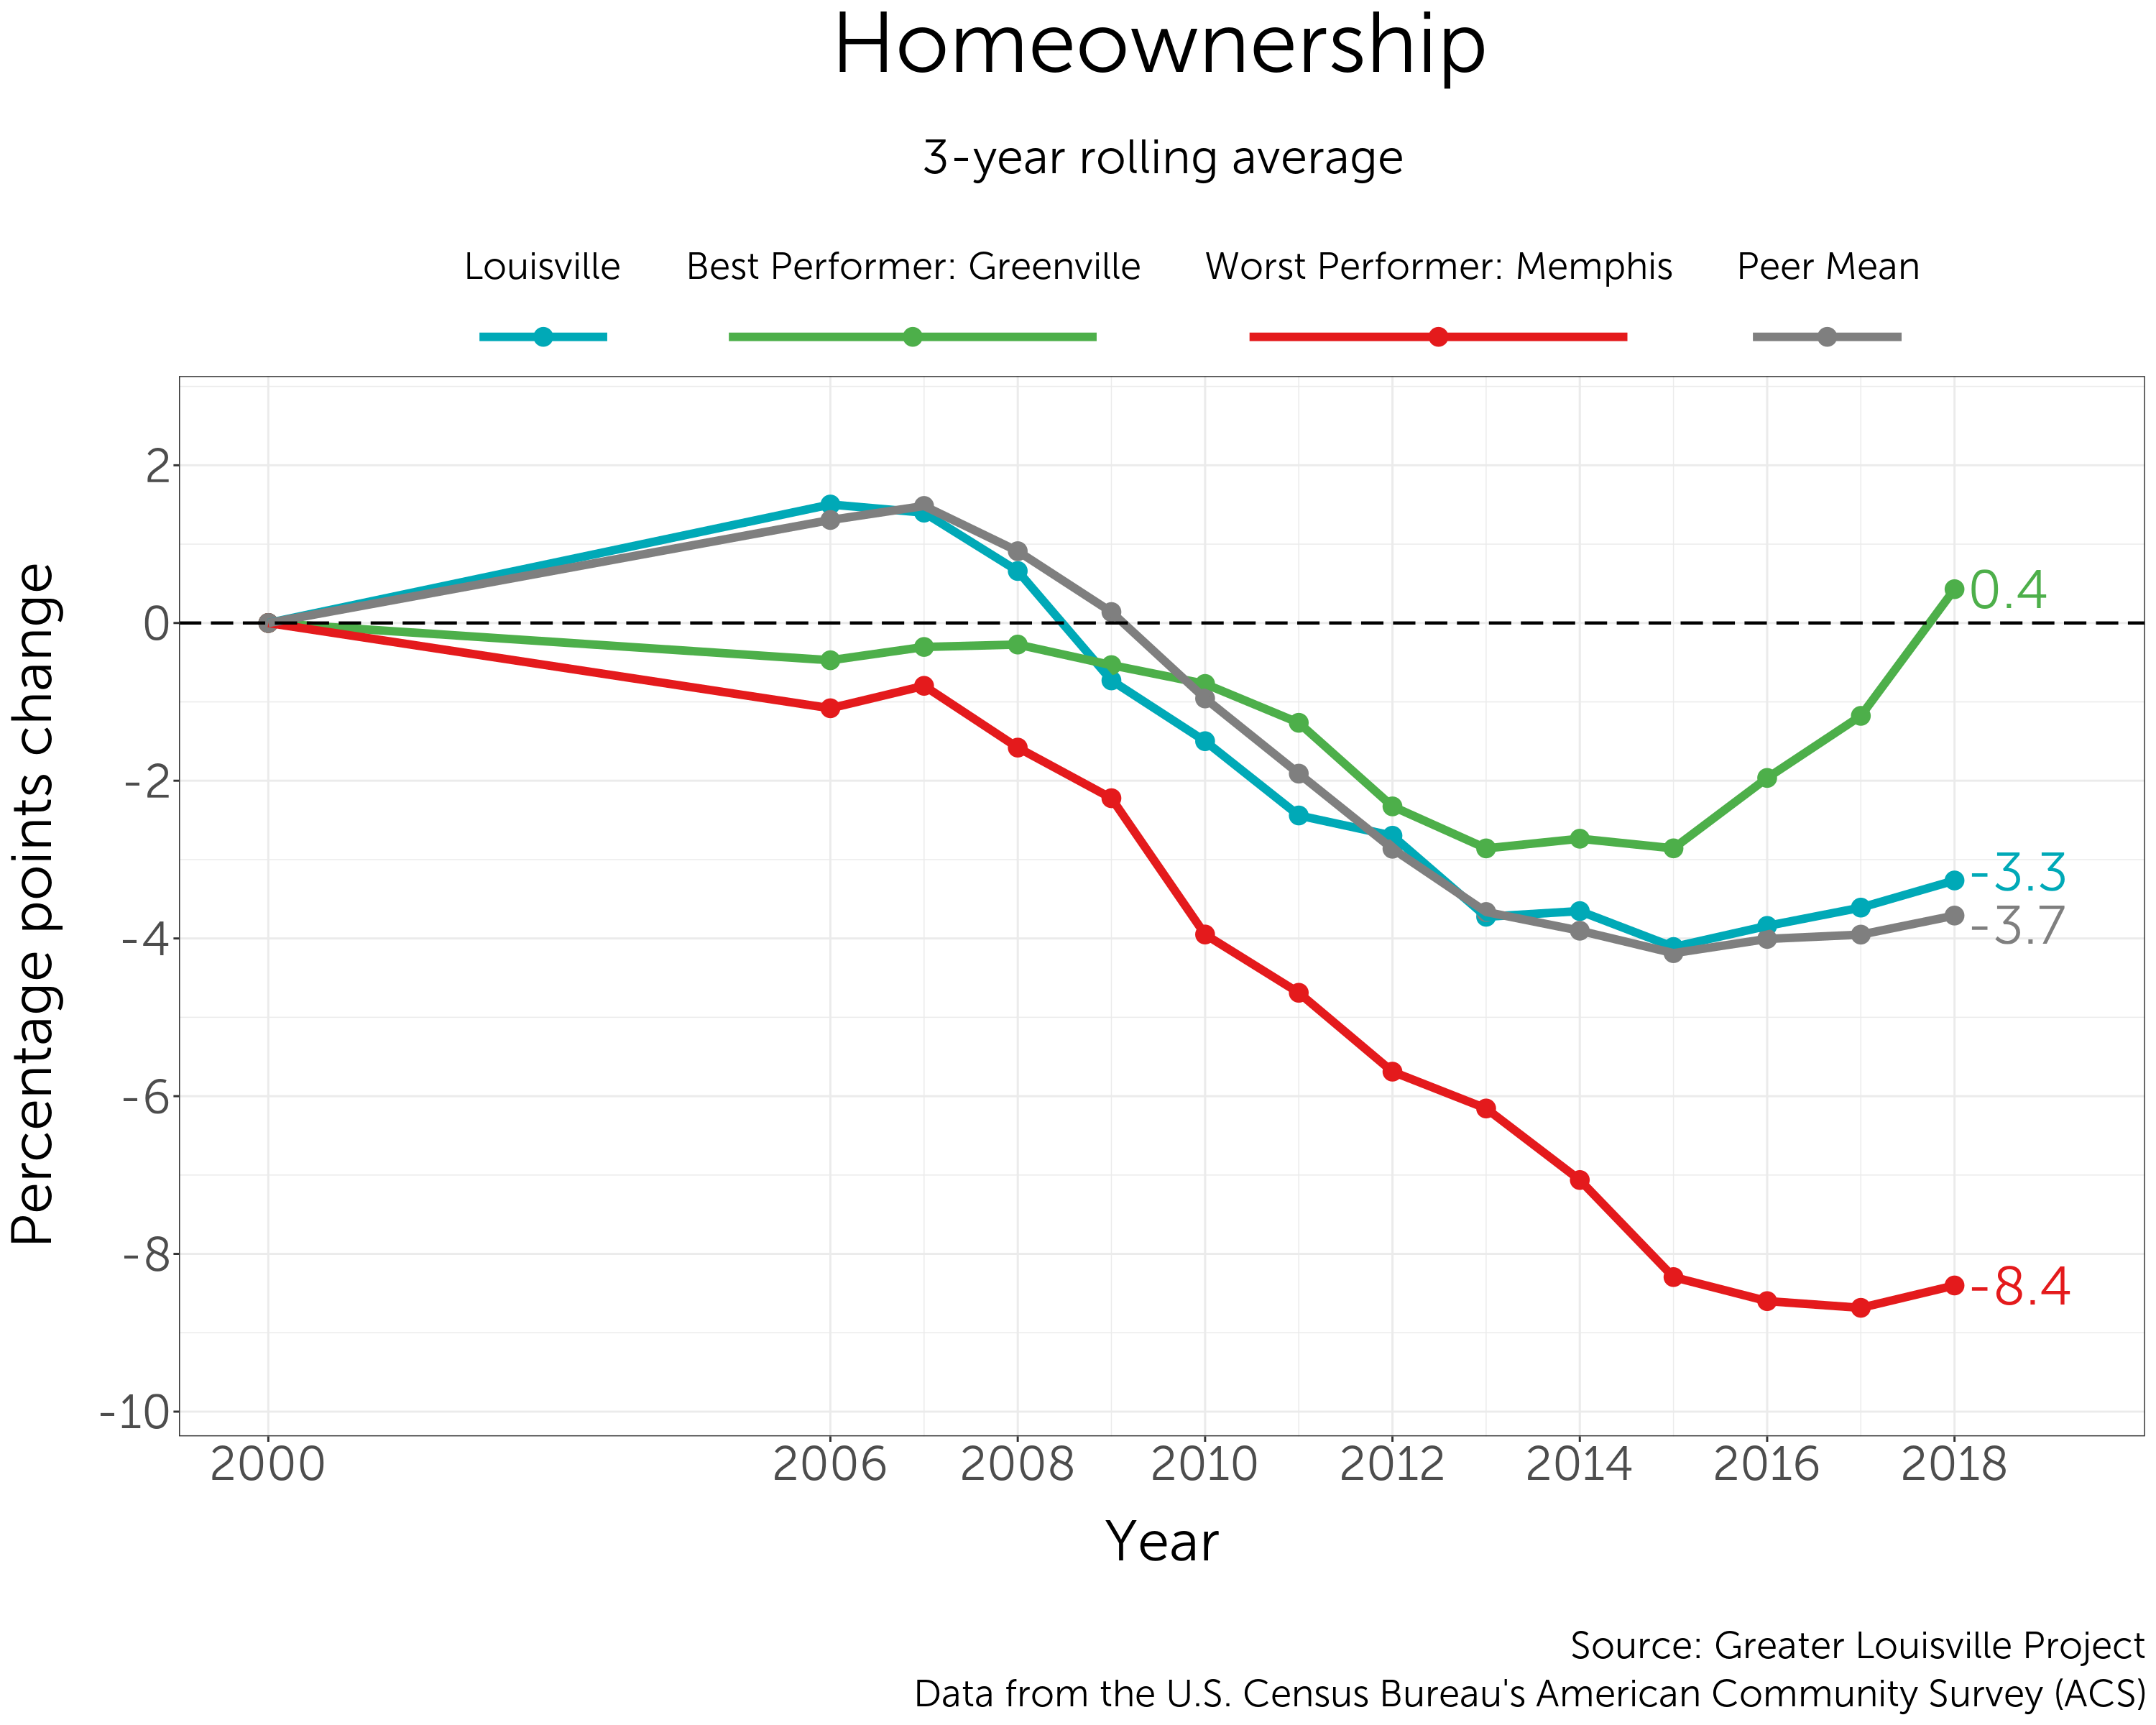
Best and Worst Peer Performers
Greenville saw a sharp uptick in its homeownership rate in recent years, making it the best performer of the group. Memphis did not see the same rebound in its homeownership rate and instead saw its rate decrease by more than 8 percentage points since 2000. Louisville ultimately saw a smaller decrease in its homeownership rate than its peers.
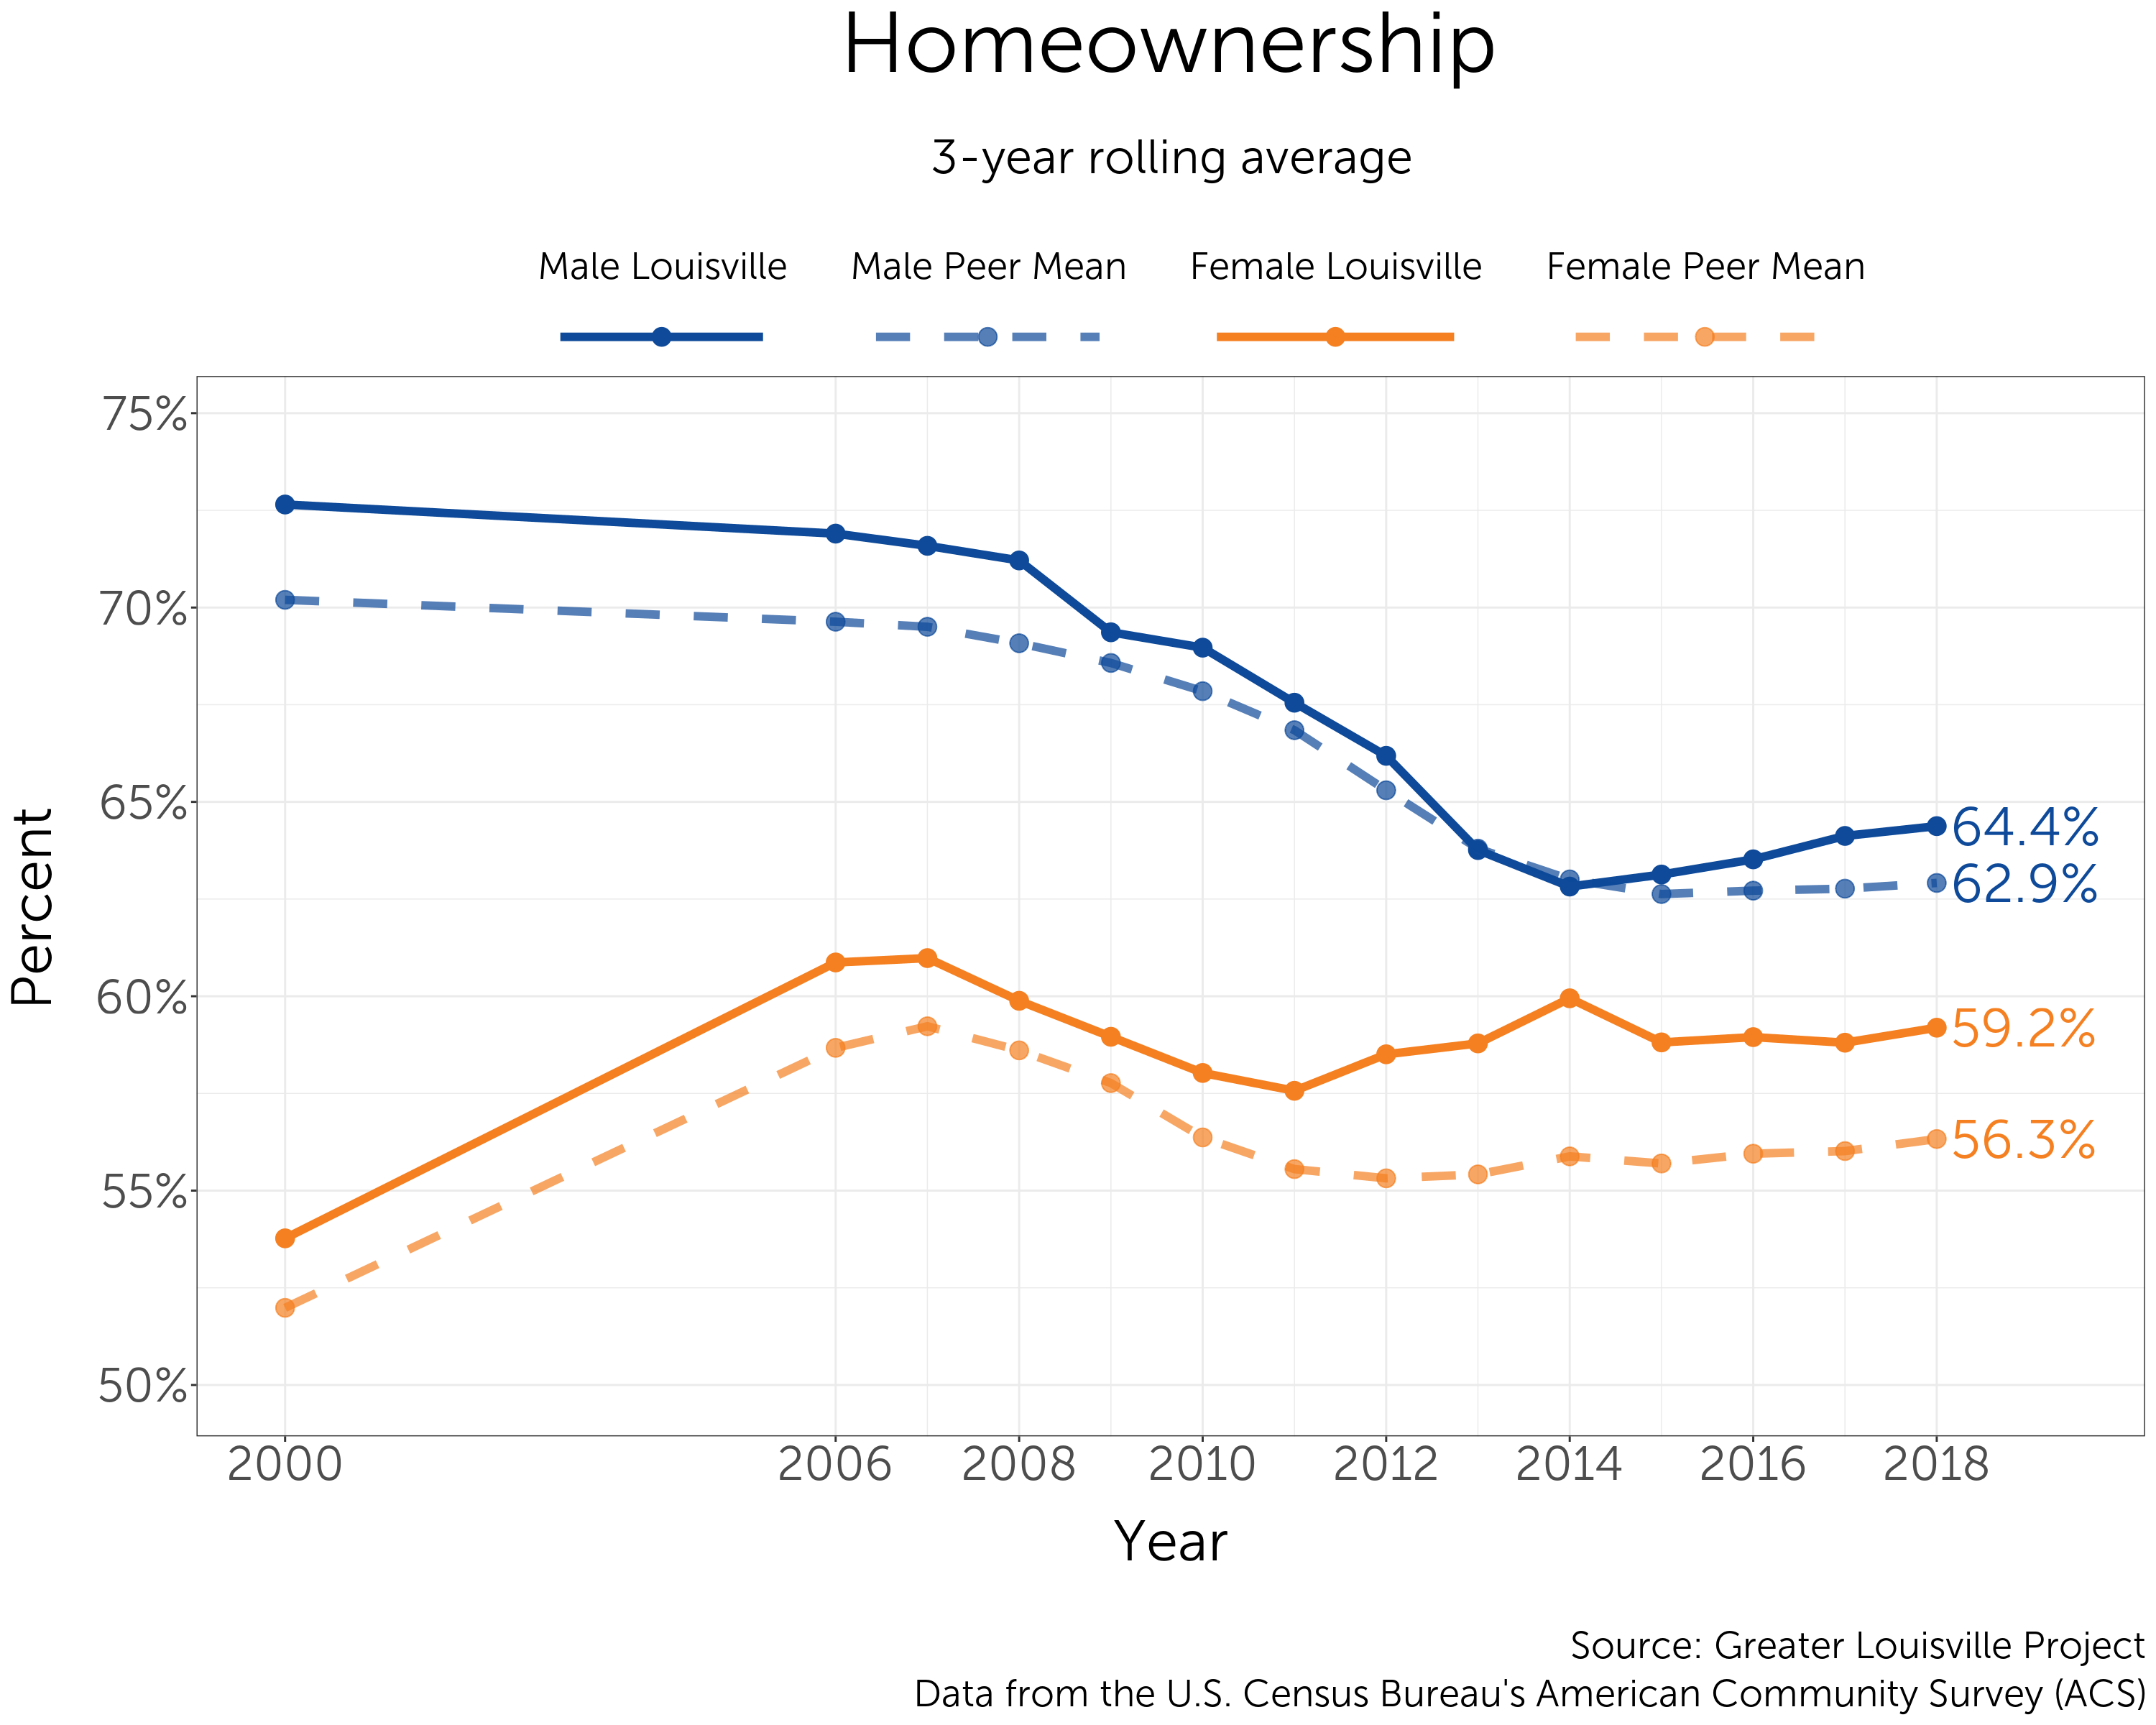
Differences by Sex
Homeownership rates among men in Louisville fell significantly following the Great Recession and have been rising modestly in recent years. In contrast, homeownership rates among women in Louisville increased slightly after the Great Recession and have since remained relatively flat.
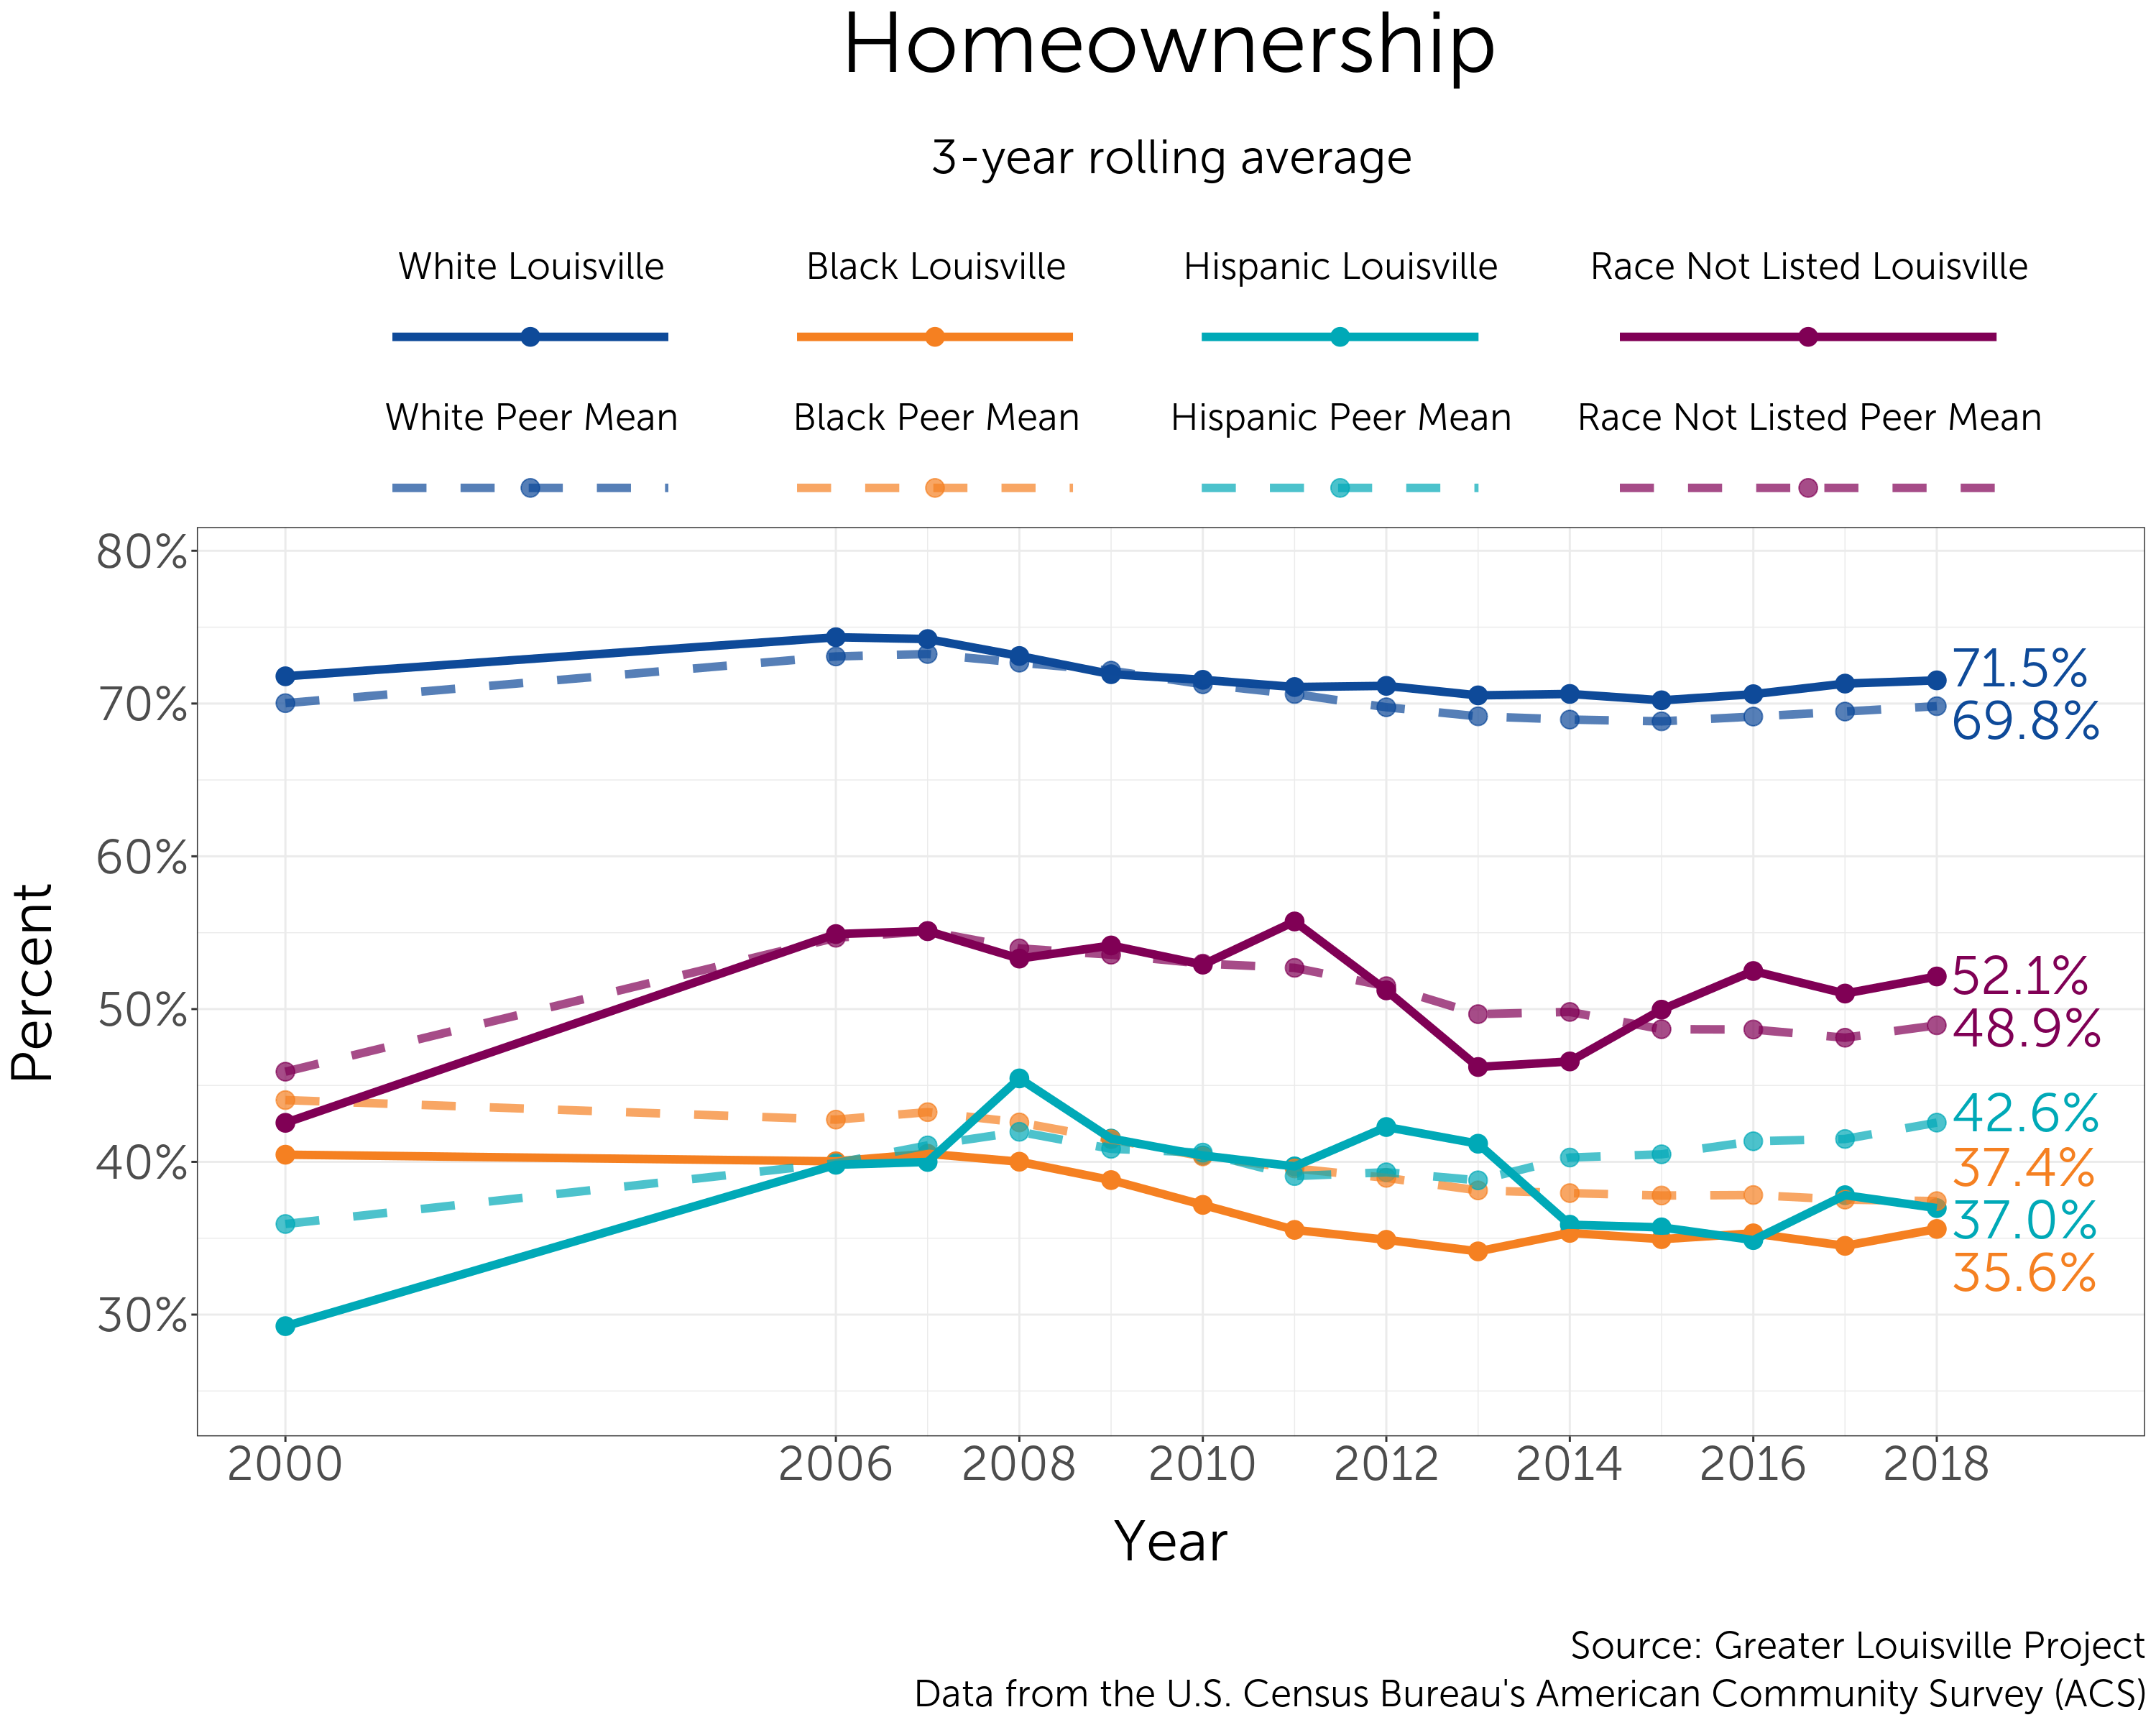
Differences by Race
The White homeownership rate sits significantly above the homeownership rates of other races in Louisville and its peer cities. In Louisville, the rates among Black and Hispanic homeowners are roughly equivalent.
Natural Breaks Algorithm
For each indicator, Greater Louisville Project assigns cities into one of three groups (high-performing, middle-of-the-pack, and low-performing) based on how they compare to other cities. The assignment is based on how cities naturally cluster on that indicator. Sometimes, the differences between cities are very small, and the difference between a city ranked 5th and 6th could simply be a matter of the sampling error that arises from using survey data. Thus, rather than always make a division that declares the top 5 to be the top tier, we use a natural breaks algorithm to look for a cluster of cities that is outperforming the rest, a cluster that is about average, and a cluster that is lagging. This clustering gives us a better indication of where Louisville is thriving and where Louisville has room to learn from cities that are doing better.
Z-Scores
Z-scores (or standardization) is a way to combine data with different units of measurement into a single index. The z-score is a measure of how far away a city (or census tract, etc.) is from the average city. In order to be comparable across different units of measurement, the z-score is the distance from the mean measured in standard deviations (e.g. if Louisville has a z-score of 1 it means Louisville is 1 standard deviation above the mean of its peer cities).
Data from the Robert Wood Johnson Foundation's County Health Rankings use z-scores and all z-scores are relative to the mean of Louisville's peer cities. (On the County Health Rankings site z-scores are relative to all the counties in each state - thus z-scores reported by GLP will be different, because we are using a different reference group). The Greater Louisville Project also uses z-scores in our multidimensional poverty index, which compares each census tract to the mean of all census tracts in Louisville.