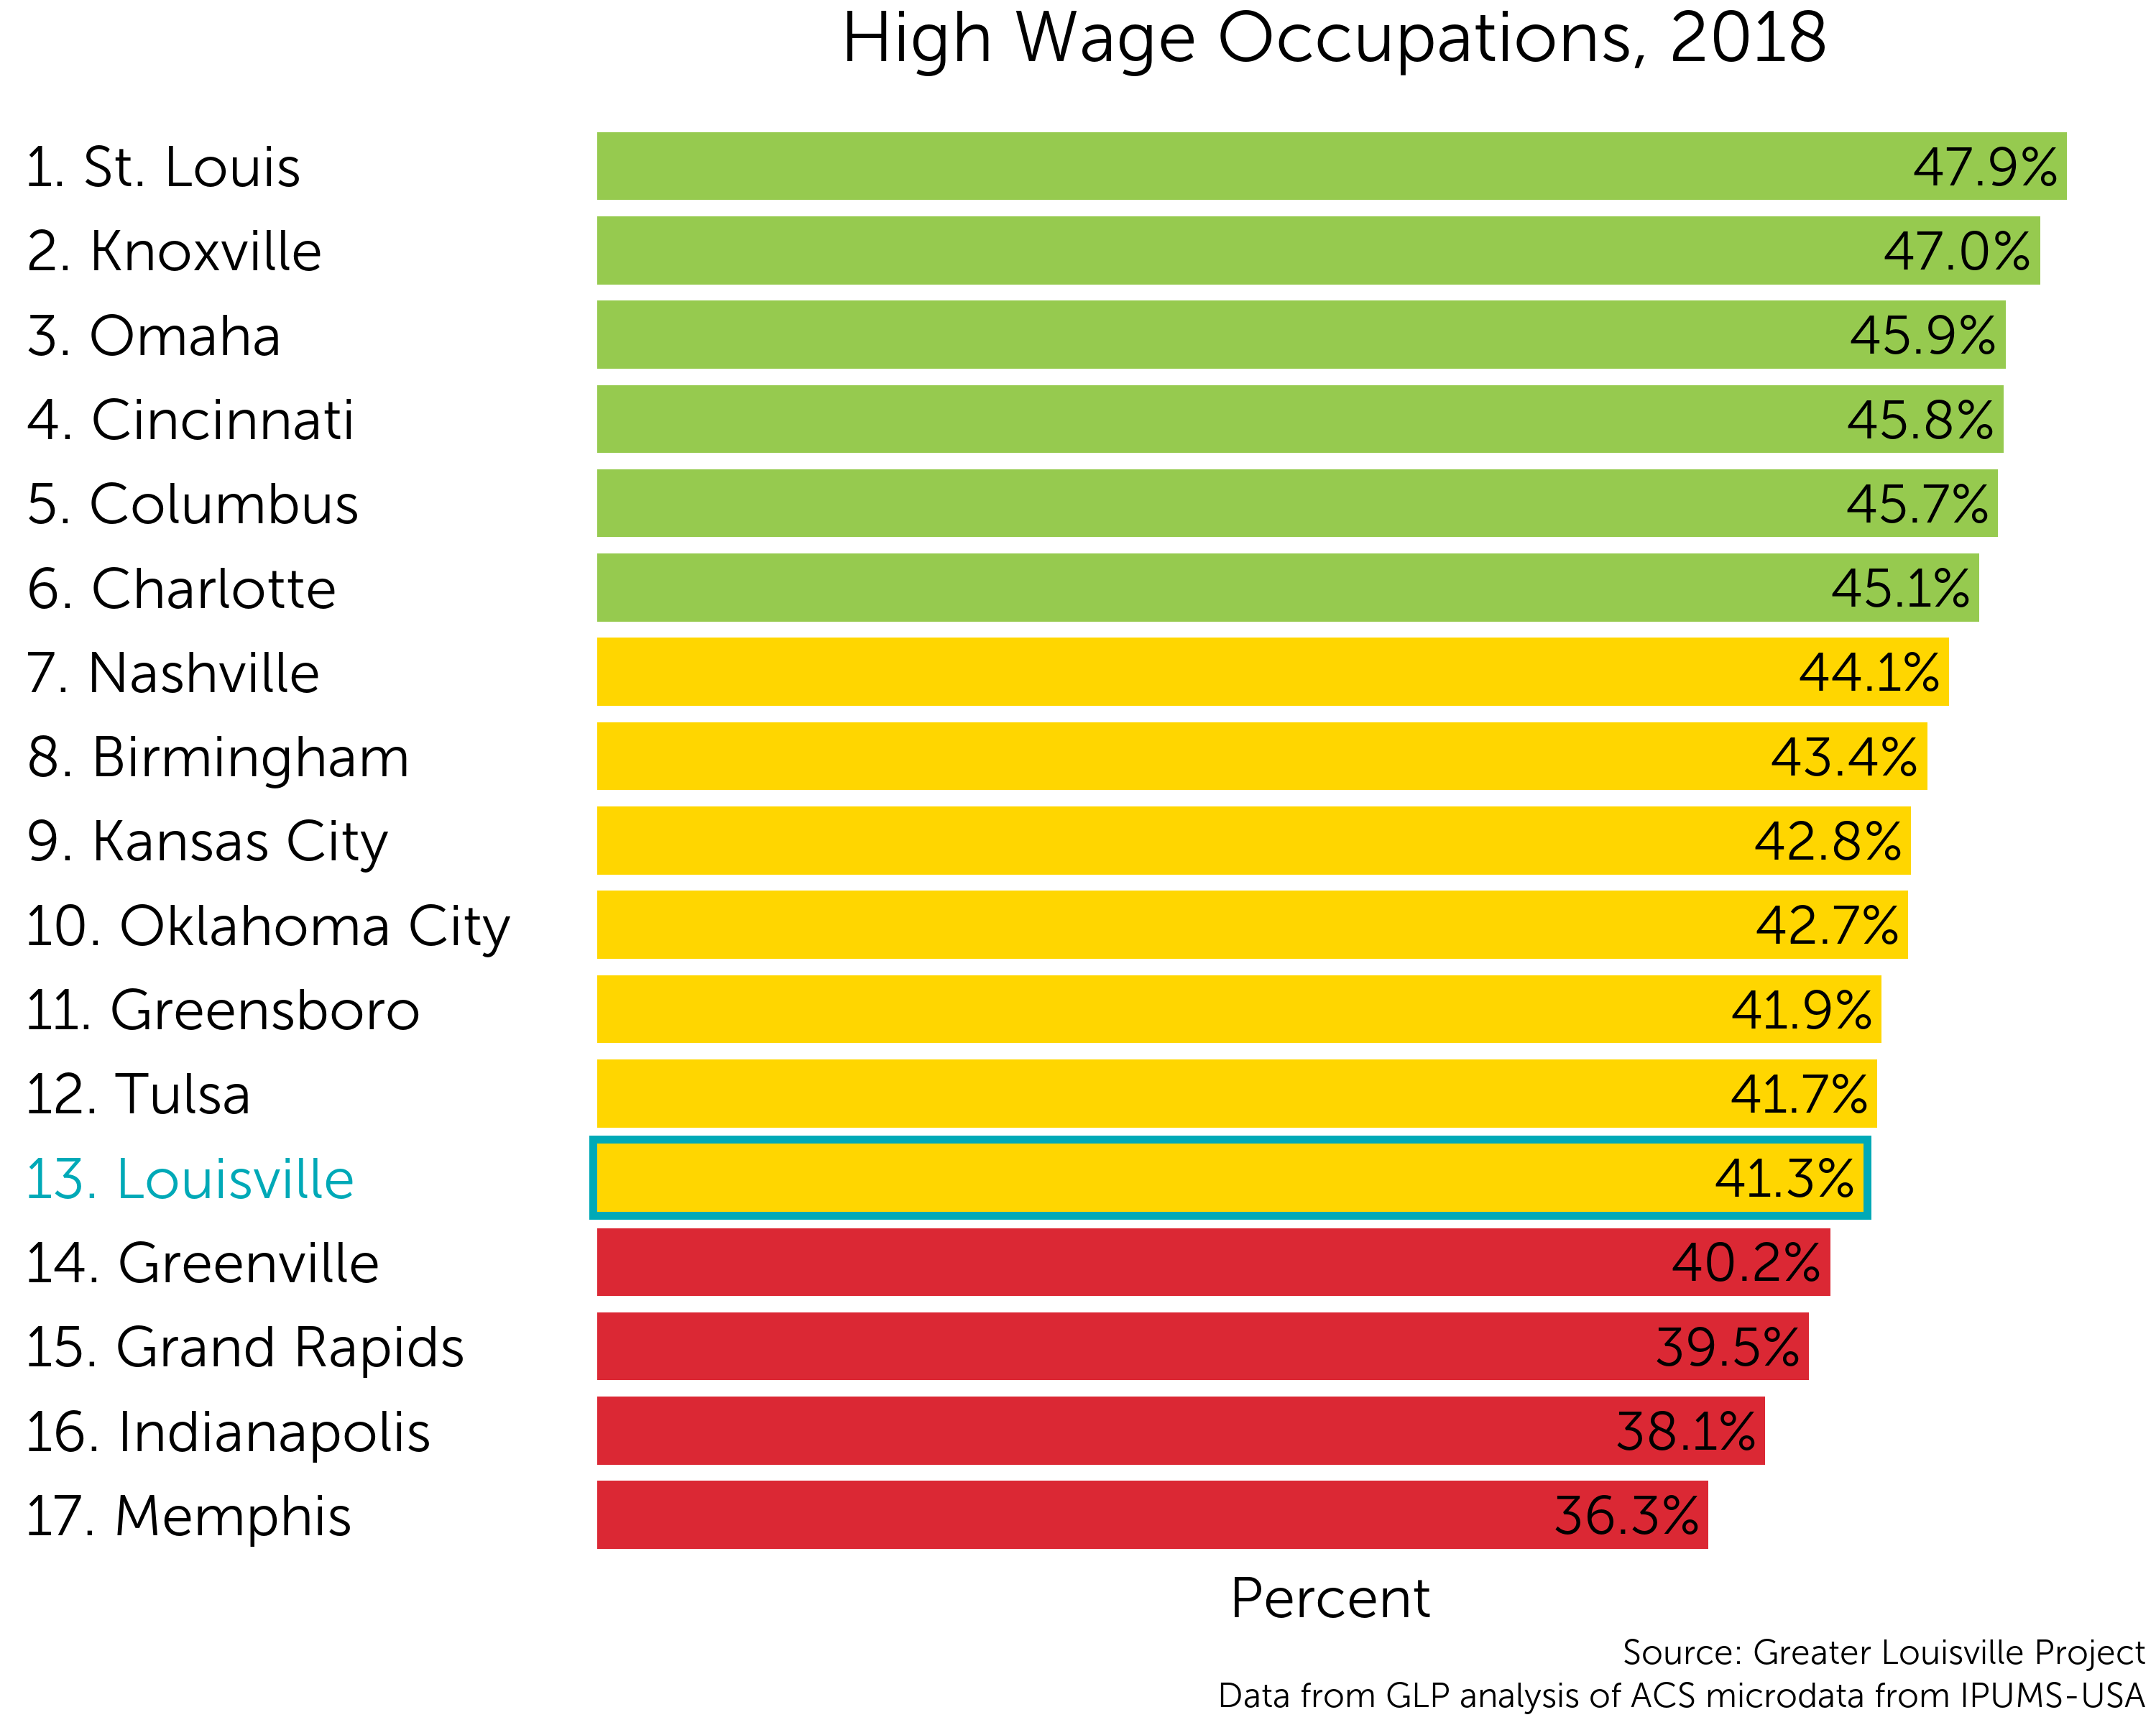
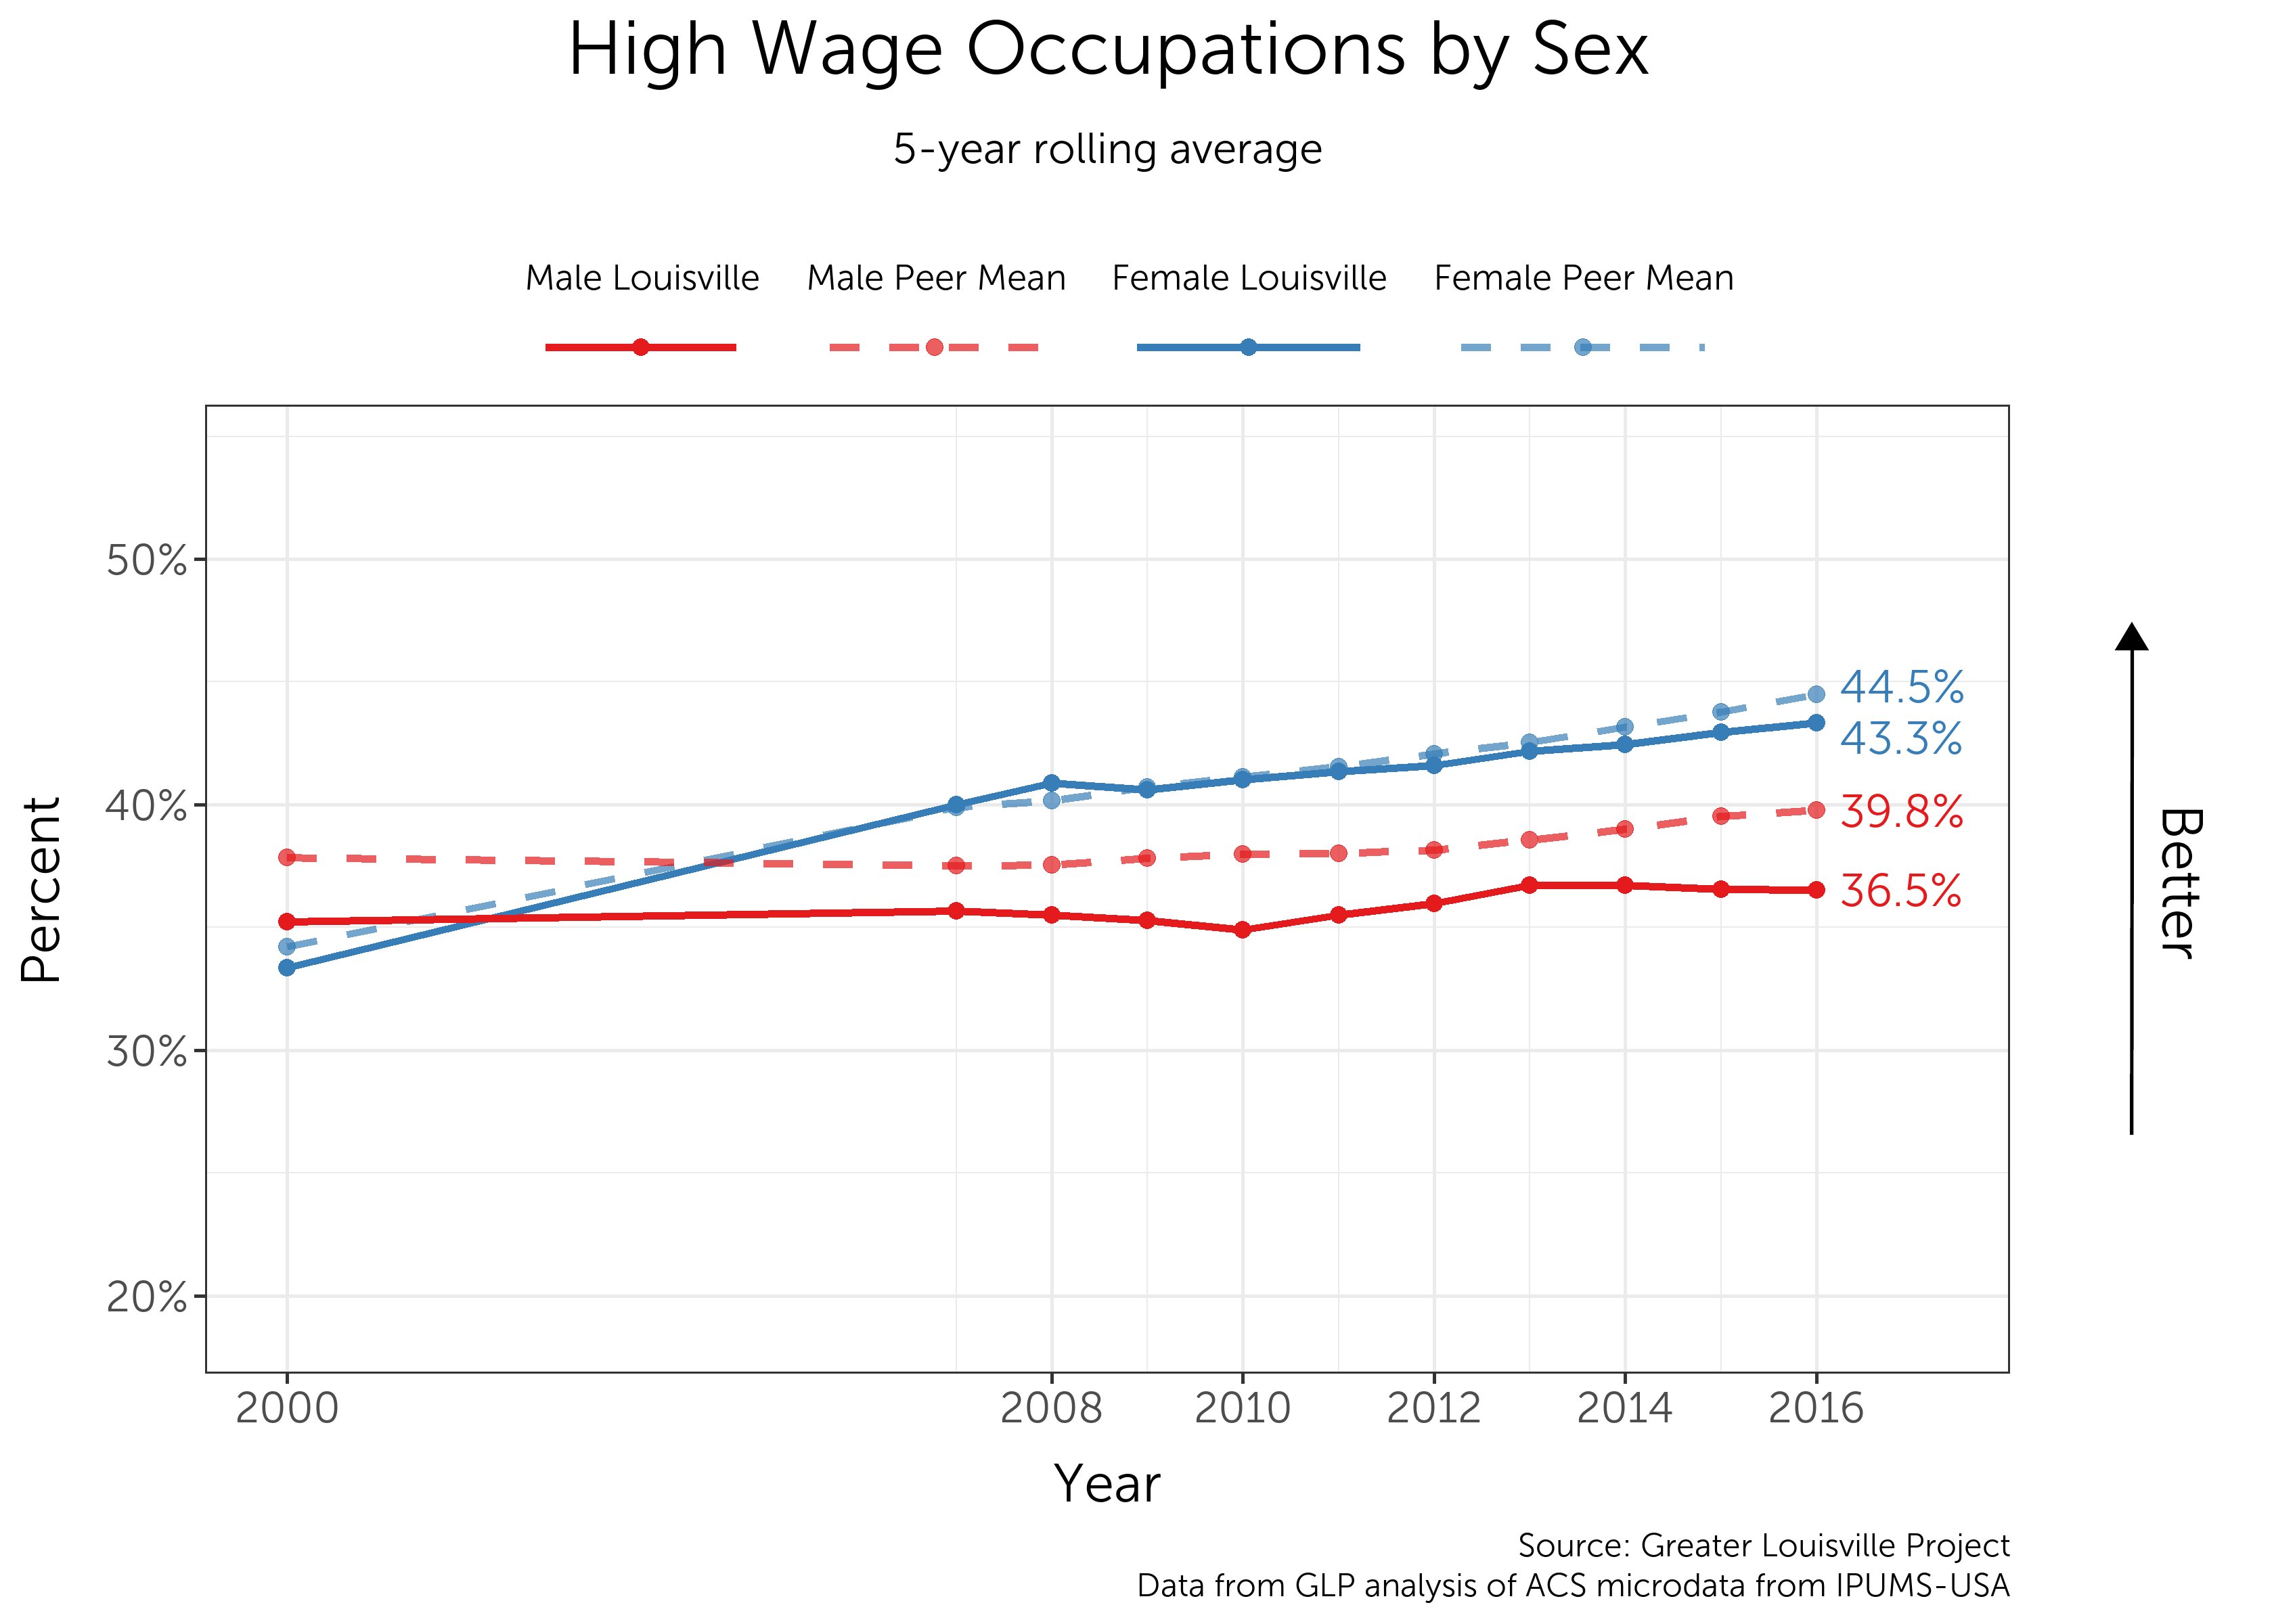
Population in High Wage Occupations

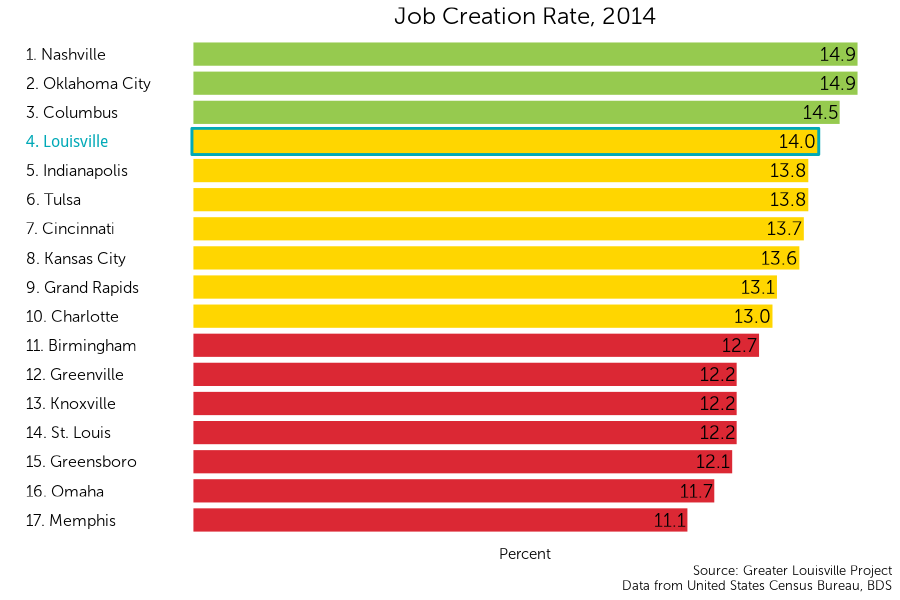
Louisville’s economic development efforts should focus the quality of jobs created, not just the quantity. Emphasizing job growth in high-wage sectors will help more families achieve financial stability and reinvest their expendable income into the community. Additionally, the percentage of high wage jobs is an important factor for individuals who are considering moving to Louisville and joining the workforce.

Peer City Perspective

Louisville currently ranks 13th among its peer cities in the rate of workers employed in high wage jobs, with 41.3% of its workforce employed in high wage jobs. Jobs are determined as high wage if their categorical assignment within the American Community Survey has a median income of greater than $35,600. These industries include management professionals, law enforcement, and construction/maintenance.

Louisville is in the middle of its peer group according to a natural breaks algorithm. Cities in green are those that outperform their peers, cities in yellow represent the middle cluster, and those in red are a group that lags behind its peers on this indicator.

Where are employees in high wage occupations found in Louisville?

There is a clear geographical divide in where workers in high wage occupations live. In the map to the left, areas where more workers in high wage occupations live are displayed in purple, while areas containing fewer can be seen in blue and white.

More workers in high wage occupations live in eastern Louisville in communities such as the Highlands and Northeast Jefferson, where the highest percentage reaches 62%. In comparison, western and southern Louisville communities have the fewest workers in high wage occupations with rates as low as 16% in the California neighborhood.

Scroll over the map to see values for each census tract. Zoom in to see street names that form the boundaries of each tract.

Trends Over Time

Since the year 2000, Louisville has trailed behind the peer mean, hovering around the 25 percentile. The city is less than one percentage point below the 25th percentile and sits at 39.9%.

Comparison Between the Most and Least Improved Cities

Louisville has never risen above the peer mean during the period of data collection shown on the graph. The percentage of Louisvillians in high wage occupations currently stands at 39.9%, below the 42.1% peer mean. Knoxville, the most improved peer city has outpaced the peer mean since 2000. Memphis, the least improved city has fallen below the peer mean since 2000.

Differences Based on Race

Louisville has a consistent gap between Black and white residents in high wage occupations. Since 2013, the gap has widened. Forty-four point 4 percent of white Louisvillians are employed in a high wage occupation. This is below their peer mean of 48.5%. Only 25.7% of Black Louisvillians are employed in high wage occupations. The gap between Black Louisvillians and the peer mean for Black people is wider than the gap for white Louisvillians and their white peers.

Differences Based on Sex

Females in Louisville began outpacing males in Louisville prior to the year 2008 in the percentage of individuals employed in high wage occupations. While both groups are currently below their respective peer means, females in Louisville are closer to their peer mean than males.

Median Earnings

Louisville’s economic development efforts must create jobs that keep families out of poverty and those that create higher incomes to drive economic prosperity. Factors like high wage job attainment, unemployment, and affordable housing indicate the state of the job market and the ability of residents to achieve financial independence and stability. The main metric for 21st-century workforce and talent is median earnings. Louisville has a target goal of being in the top 50% of its peers in median earnings.

Peer City Comparison

Louisville’s median earnings of $33,300 ranks 6th among its peer cities.

Louisville is in the middle of its peer group according to a natural breaks algorithm. Cities in green are a cluster that outperforms their peers, yellow represents the middle cluster, and red is a group that lags behind its peers on this indicator.

How does median earnings vary across Louisville?

Louisville’s median income varies greatly across the city. In the map to the left, areas with higher median earnings are displayed in purple, and areas with lower median wages are displayed in white.

Workers in eastern Louisville receive much higher earnings than residents in west and south Louisville. Residents in J-town have a median earning of $45,800, followed by residents of Northeast Louisville who receive a median earning of $43,400. Residents of the Algonquin-Park Hill-Park Duvalle neighborhood only receive a median earning of $16,500. Downtown and Old Louisville residents also show a lower median earning, of only $18,000.

Scroll over the map to see values for each census tract. Zoom in to see street names that form the boundaries of each tract.

Trends Over Time

Median earnings Louisville fell during the Great Recession and have since recovered. Earnings have increased steadily 2011.

Comparison Between the Most and Least Improved Cities

Louisville’s median earnings increased by $700 between 2000 and 2016, outperforming the average peer city where median earnings fell by $400 over the same time period. The most improved city, Knoxville, saw median earnings increase by $2,800, while Indianapolis has seen median earnings fall by $3,000.

Differences Based on Race

In Louisville and across peer cities, White residents continue to have higher median earnings than Black residents. White residents in Louisville earn around $12,000 more than Black residents. Median earnings for both White and Blacks linger below their respective peer city means.

Differences Based on Sex

Males earn more than females in Louisville and across peer cities. Both males and females in Louisville outperform their peer mean.

Median Earnings Gap

The gap in median earnings between White residents and Black residents is currently increasing. While the earnings gap in Louisville is smaller than the peer average, this is due to relatively lower wages for White Louisville residents, not relatively high wages for Black Louisville residents.

Job Creation Rate

Job creation is an important measure of economic success for businesses and for workers. New jobs offer workers the opportunity to gain employment, and a high job creation rate indicates that businesses are optimistic about about future growth.

Peer City Perspective

Louisville currently ranks 4th among its peer cities in job creation rate with a rate of 14%. Job creation rate represents the percentage of jobs that have been created within the past twelve months.

Louisville is in the middle of its peer group according to a natural breaks algorithm. Cities in green are those that outperform their peers, cities in yellow represent the middle cluster, and those in red lag behind its peers on this indicator.

Trends Over Time

The job creation rate in Louisville has been steadily increasing since 2010. Before and during the recession, Louisville’s job creation rate declined and it consistently underperformed relative to its peer cities. Since 2010, however, Louisville’s growth has pushed it above the peer city mean.

Job Destruction Rate

Job destruction is an important measure of economic well-being. It describes the number of jobs the city is losing and signifies that businesses are contracting. To maintain a healthy economy, Louisville must limit the number of positions that are eliminated.

Peer City Perspective

Louisville currently ranks 13th among its peer cities in job destruction death rate with a rate of 11.3%. The job destruction rate represents the percentage of jobs that have been eliminated over the previous twelve months.

On this metric, Louisville is in the middle of its peer group according to a natural breaks algorithm. Cities in green are those that outperform their peers, cities in yellow represent the middle cluster, and those in red are a group that lags behind its peers on this indicator.

Trends Over Time

The job destruction rate in Louisville has trended downward since 2008. Although the city has made progress, Louisville’s ranking in terms of its peer cities has been declining since then. While the city was not as strongly impacted by the recession than its peers, it has also not made as much progress as its peers since 2008.

Median Household Income

Median household income is an economic indicator commonly used as a proxy for quality of life. This metric is also often used to determine if residents in a given location are able to afford the cost of living of residing in that area. In conjunction with per capita income, median household income is used to determine the wealth of a given region. This metric includes both part-time and full-time workers.

Peer City Perspective

Louisville currently ranks 10th among its peer cities in median household income with a median income of $55,000.

Louisville is in the middle of its peer group according to a natural breaks algorithm. Cities in green are those that outperform their peers, cities in yellow represent the middle cluster, and those in red are a group that lags behind its peers on this indicator.

How does the median household income vary across Louisville?

There is tremendous variation in income across the city. In the map to the left, areas with higher median household income are displayed in green, and areas with lower median household income are displayed in red.

A dramatic divide in median household earnings exists in Louisville. Households in eastern Louisville receive higher median earnings than those in West Louisville. As showcased on the map to the left, households in Floyd’s Fork garner a median earning of over $80,000. Households downtown and in Old Louisville garner a media wage of only $17,800. Residents in the Phoenix Hill and Smoketown receive a median earning of $18,200. Russell neighborhood households receive a median income of $20,400.

Scroll over the map to see values for each census tract. Zoom in to see street names that form the boundaries of each tract.

Trends Over Time

After a period of decline from 2000 to 2009, Louisville’s median household income began to rise. Since 2011, median household income in Louisville has seen a steady rate of improvement relative to its peers and moved from close to the 25th percentile to near the peer mean.

Comparison Between the Most and Least Improved Cities

The median income in Knoxville, the most improved city, increased from $3,500 below the peer mean in 2000 to $1,400 above the peer mean in 2016. Louisville’s median household income decreased by $300, compared to an average decrease of $1,600 among peer cities. Median household income in Indianapolis, the worst-performing peer city, decreased by almost $9,000.

Unemployment

The unemployment rate of a given economy is a key economic indicator of labor market performance. When workers are unemployed, their households lose wages and the economy as a whole loses that individual’s contribution to the economy in terms of goods and services that they would have otherwise produced. Keeping the unemployment rate at a reasonably low level is key to creating a prosperous Louisville.

Peer City Perspective

Louisville currently ranks 12th among its peer cities in rates of unemployment with an unemployment rate of 5.6%. According to the Bureau of Labor Statistics, an individual is considered unemployed when they are actively searching for employment but are unable to find work.

On this metric, Louisville sits in the middle of its peer group according to a natural breaks algorithm. Cities in green are those that outperform their peers, cities in yellow represent the middle cluster, and those in red are a group that lags behind its peers on this indicator.

How does unemployment vary across Louisville?

Although Louisville ranks 12th out of 17 cities in unemployment, there is tremendous variation across the city. In the map to the left, areas with lower levels of unemployment are displayed in white, and areas with higher levels of unemployment are displayed in purple.

Floyd’s Fork and areas near the airport show the lowest unemployment rate of 2.8%.  Fern Creek, St. Matthews,  and Northeast Jefferson County have unemployment rates of 3.1%, 3.3%, and 3.8%, respectively. The Russel neighborhood shows a substantially higher unemployment rate of 26.1%. This rate is the highest of all Louisville neighborhoods.

Scroll over the map to see values for each census tract. Zoom in to see street names that form the boundaries of each tract.

Trends Over Time

Unemployment in Louisville has steadily decreased since it peaked in 2010 at 11.2%. Since then, Louisville consistently had a rate of unemployment higher than its peer city average. As of 2016, the city’s unemployment rate was at 5.8%, above the peer city mean, but below the 75th percentile.

Comparison Between the Most and Least Improved Cities

The least improved peer city, Tulsa, had relatively low levels of unemployment during the Great Recession but has struggled to continue reducing unemployment in line with peer cities in recent years. Nashville is the most improved peer city with an unemployment rate of 4.4%. The average unemployment rate in peer cities decreased from a high of 10.1% in 2010 to 5.5% in 2016.


Differences Based on Race

Across peer cities, Black residents continue to experience higher unemployment rates than Whites. In 2016, the unemployment rate among Black Louisville residents was about three times the unemployment rate among white Louisville residents. While the unemployment rate for White residents in Louisville has been declining since 2010, the rate for Blacks increased from 2015 to 2016. The unemployment rate for White Louisvillians decreased from above the 75th percentile of peer cities during the Great Recession to the peer mean in 2016. The rate for Black Louisvillians has remained consistely above their peer mean near the 75th percentile.

Differences Based on Sex

Since 2009, Louisville males have had a higher unemployment rate than Louisville females. The unemployment rate for Louisville males is slightly above their peer city mean, while the rate for Louisville females is at their peer city mean.

Income Inequality

Growing income inequality is the result of educational disparities, stagnant wage growth in middle and lower class jobs, and a higher emphasis on creating a skilled workforce. Economists are divided on whether the implications of income inequality are positive or negative. Income inequality is the ratio of the average income of the top 20% of the population to the average income of the bottom 20% of the population.

Peer City Perspective

Louisville ranks 9th among its peer cities in income inequality. The average income of the top 20% of Louisville residents is 15.7 times greater than the average income of the bottom 20%.

Louisville ranks among the middle tier on this metric according to a natural breaks algorithm. Cities in green are those that outperform their peers, cities in yellow represent the middle cluster, and those in red are a group that lags behind its peers on this indicator.

Trends Over Time

Income inequality in Louisville has been decreasing since 2013, returning to the same level as measured in 2007. Income inequality in Louisville has decreased from the peer mean and is approaching the 25th percentile.

Comparison Between the Most and Least Improved Cities

The average peer city saw a slight increase in the income inequality ratio between 2007 and 2016. Columbus, the most improved city, saw a small decrease. Indianapolis, the least improved city, saw its income inequality ratio increase from 13.6 to 17.1.