NAEP Reading Scores

The National Association of Educational Progress (NAEP)  administers standardized assessments to students across the United States every two years. The test assesses students’ knowledge and skills in math and reading. NAEP scores are valuable indicators of student performance compared to schools within Kentucky and across the nation. The date below pertain to public school students.

Trends Over Time

The average scores for students in both JCPS and other districts in Kentucky have remained fairly constant since 2012. JCPS students perform close to the level of KY public school students, a trend not seen in all other metrics.  According to the NAEP, the average JCPS score is above the basic level but below proficiency. The reading exam given to 4th graders is out of 500 points.

Differences Based on Race

JCPS students perform near the level of their Kentucky counterparts across all races. White JCPS students outperform other Kentucky students.

Differences Based on Sex

Male and female JCPS students currently have average NAEP reading scores slightly below their statewide peers.

Differences Based on Free or Reduced Lunch Status

Students that qualify for free or reduced lunch continue to obtain lower NAEP reading schools both in JCPS and in KY public schools. JCPS students with higher family incomes typically perform at or above the level of their Kentucky peers, while JCPS students with lower family incomes usually perform several points below the state average for their peers.

NAEP Math Scores

The National Association of Educational Progress (NAEP) administers standardized assessments to students across the United States every two years. The test assesses students’ knowledge and skills in math and reading. NAEP scores are valuable indicators of student performance compared to schools within Kentucky and across the nation. The data below pertains to students enrolled in public schools.

Trends Over Time

The average scores for students in both JCPS and other public school districts in Kentucky have remained fairly constant since 2012. JCPS scores are typically 5 to 10 points below the statewide average. According to the NAEP, the average JCPS score is above the basic level but below proficiency. The math exam given to 4th graders is out of 500 points.

Differences Based on Race

White students in JCPS usually perform at the same level as their Kentucky peers. Both within JCPS and across Kentucky, Black students continue to lag behind their peers. As of 2017, Black students in Kentucky are performing slightly better than their JCPS peers.


Differences Based on Sex

LSince 2009, males and females attending JCPS schools have received lower NAEP math scores than their public school Kentucky counterparts. Within JCPS, males slightly outperform females.

Differences Based on Free or Reduced Lunch Status

Publics school students from families with higher incomes receive higher NEAP math scores than their counterparts eligible for free or reduced lunch. JCPS and KY students not on free or reduced lunch receive about the same NAEP math schores. JCPS students qualifying for free or reduced lunch are 8 points behind their KY counterparts.

Transition Readiness

(Formerly College and Career Readiness)

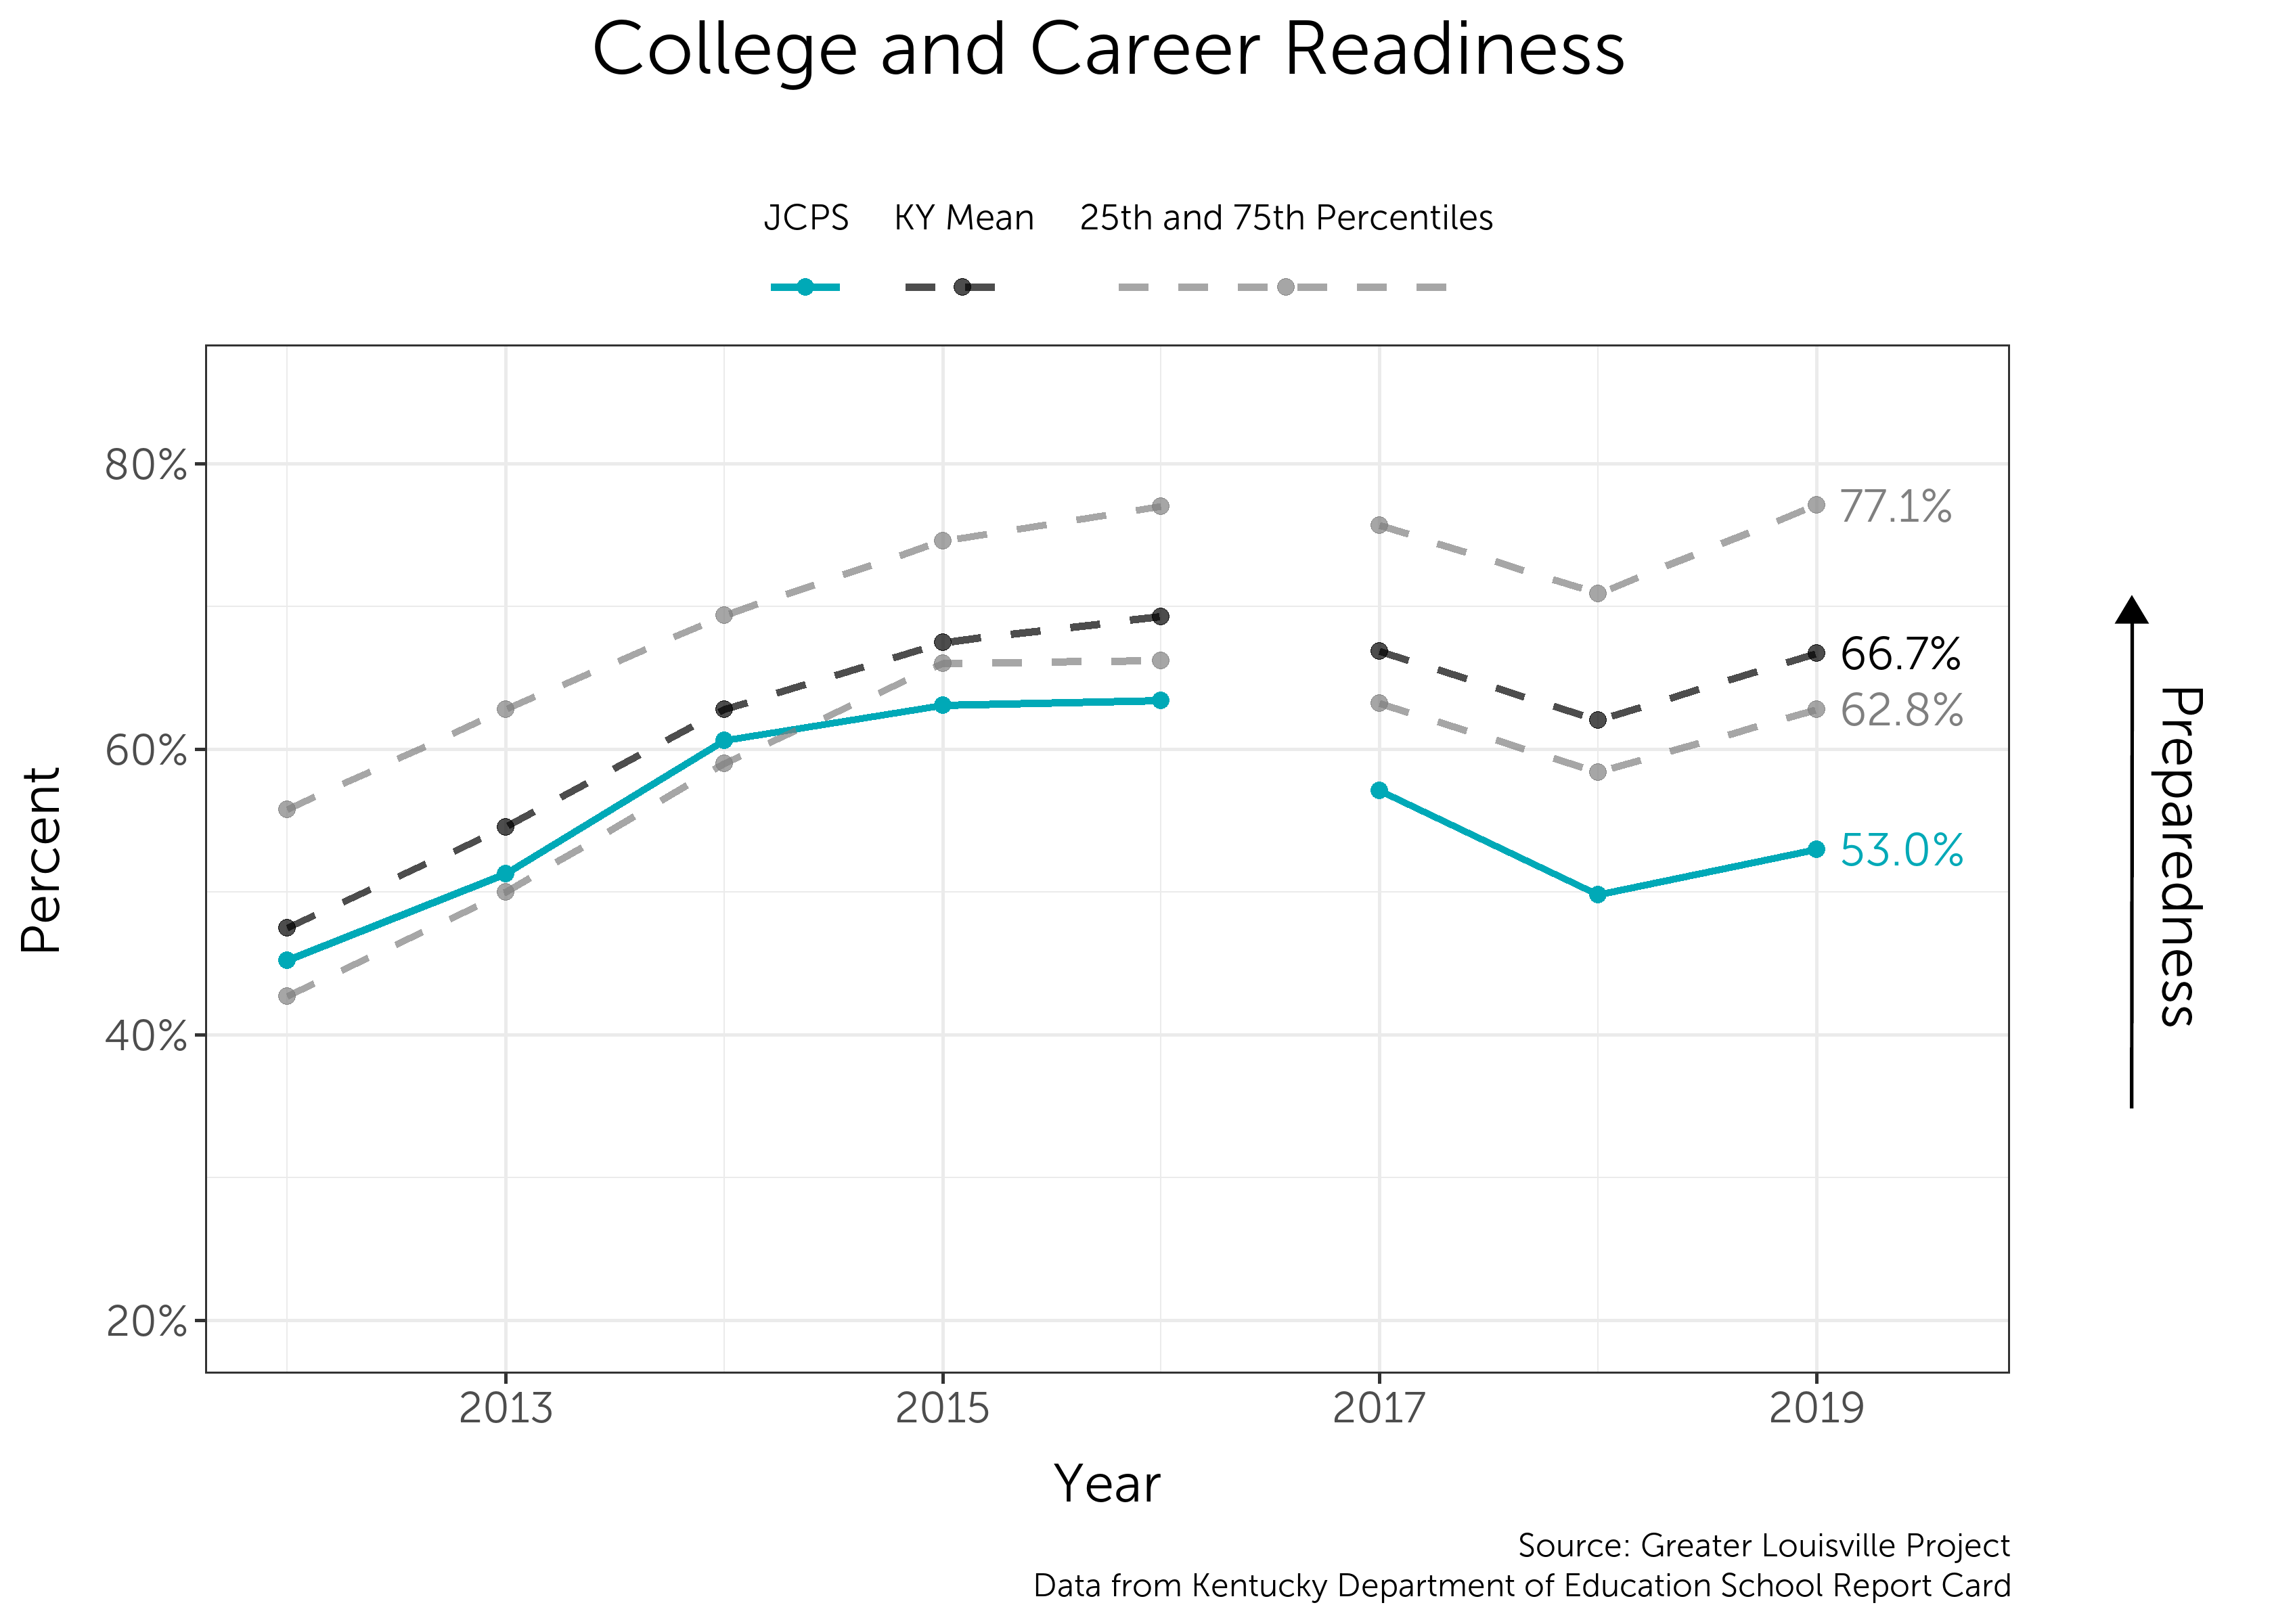
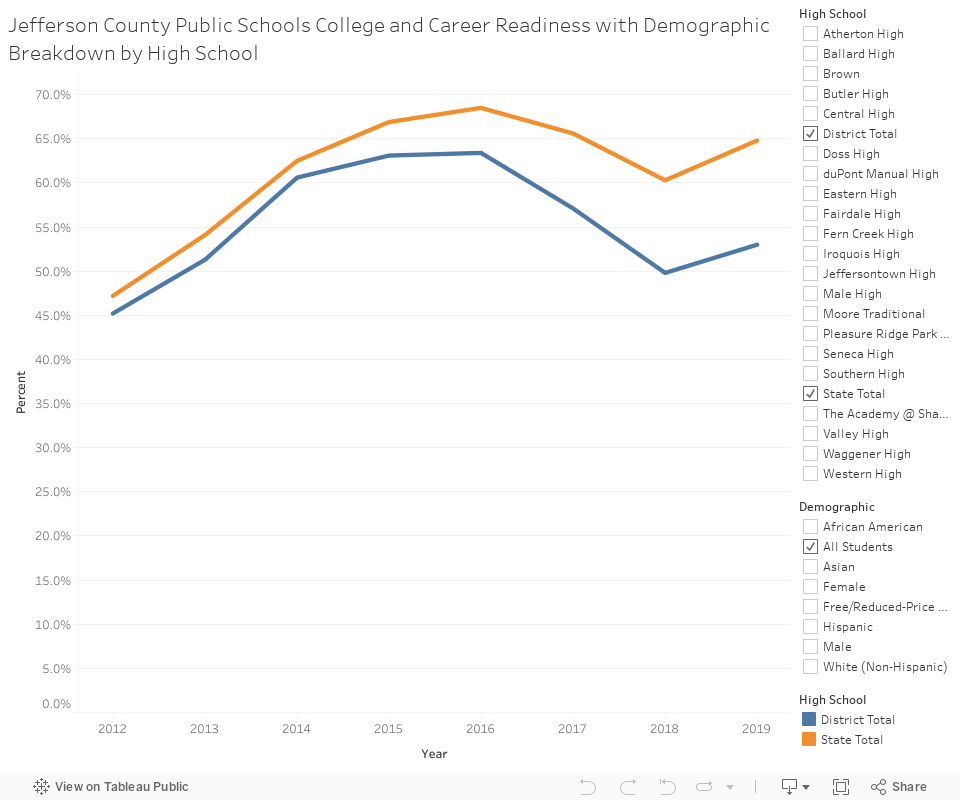
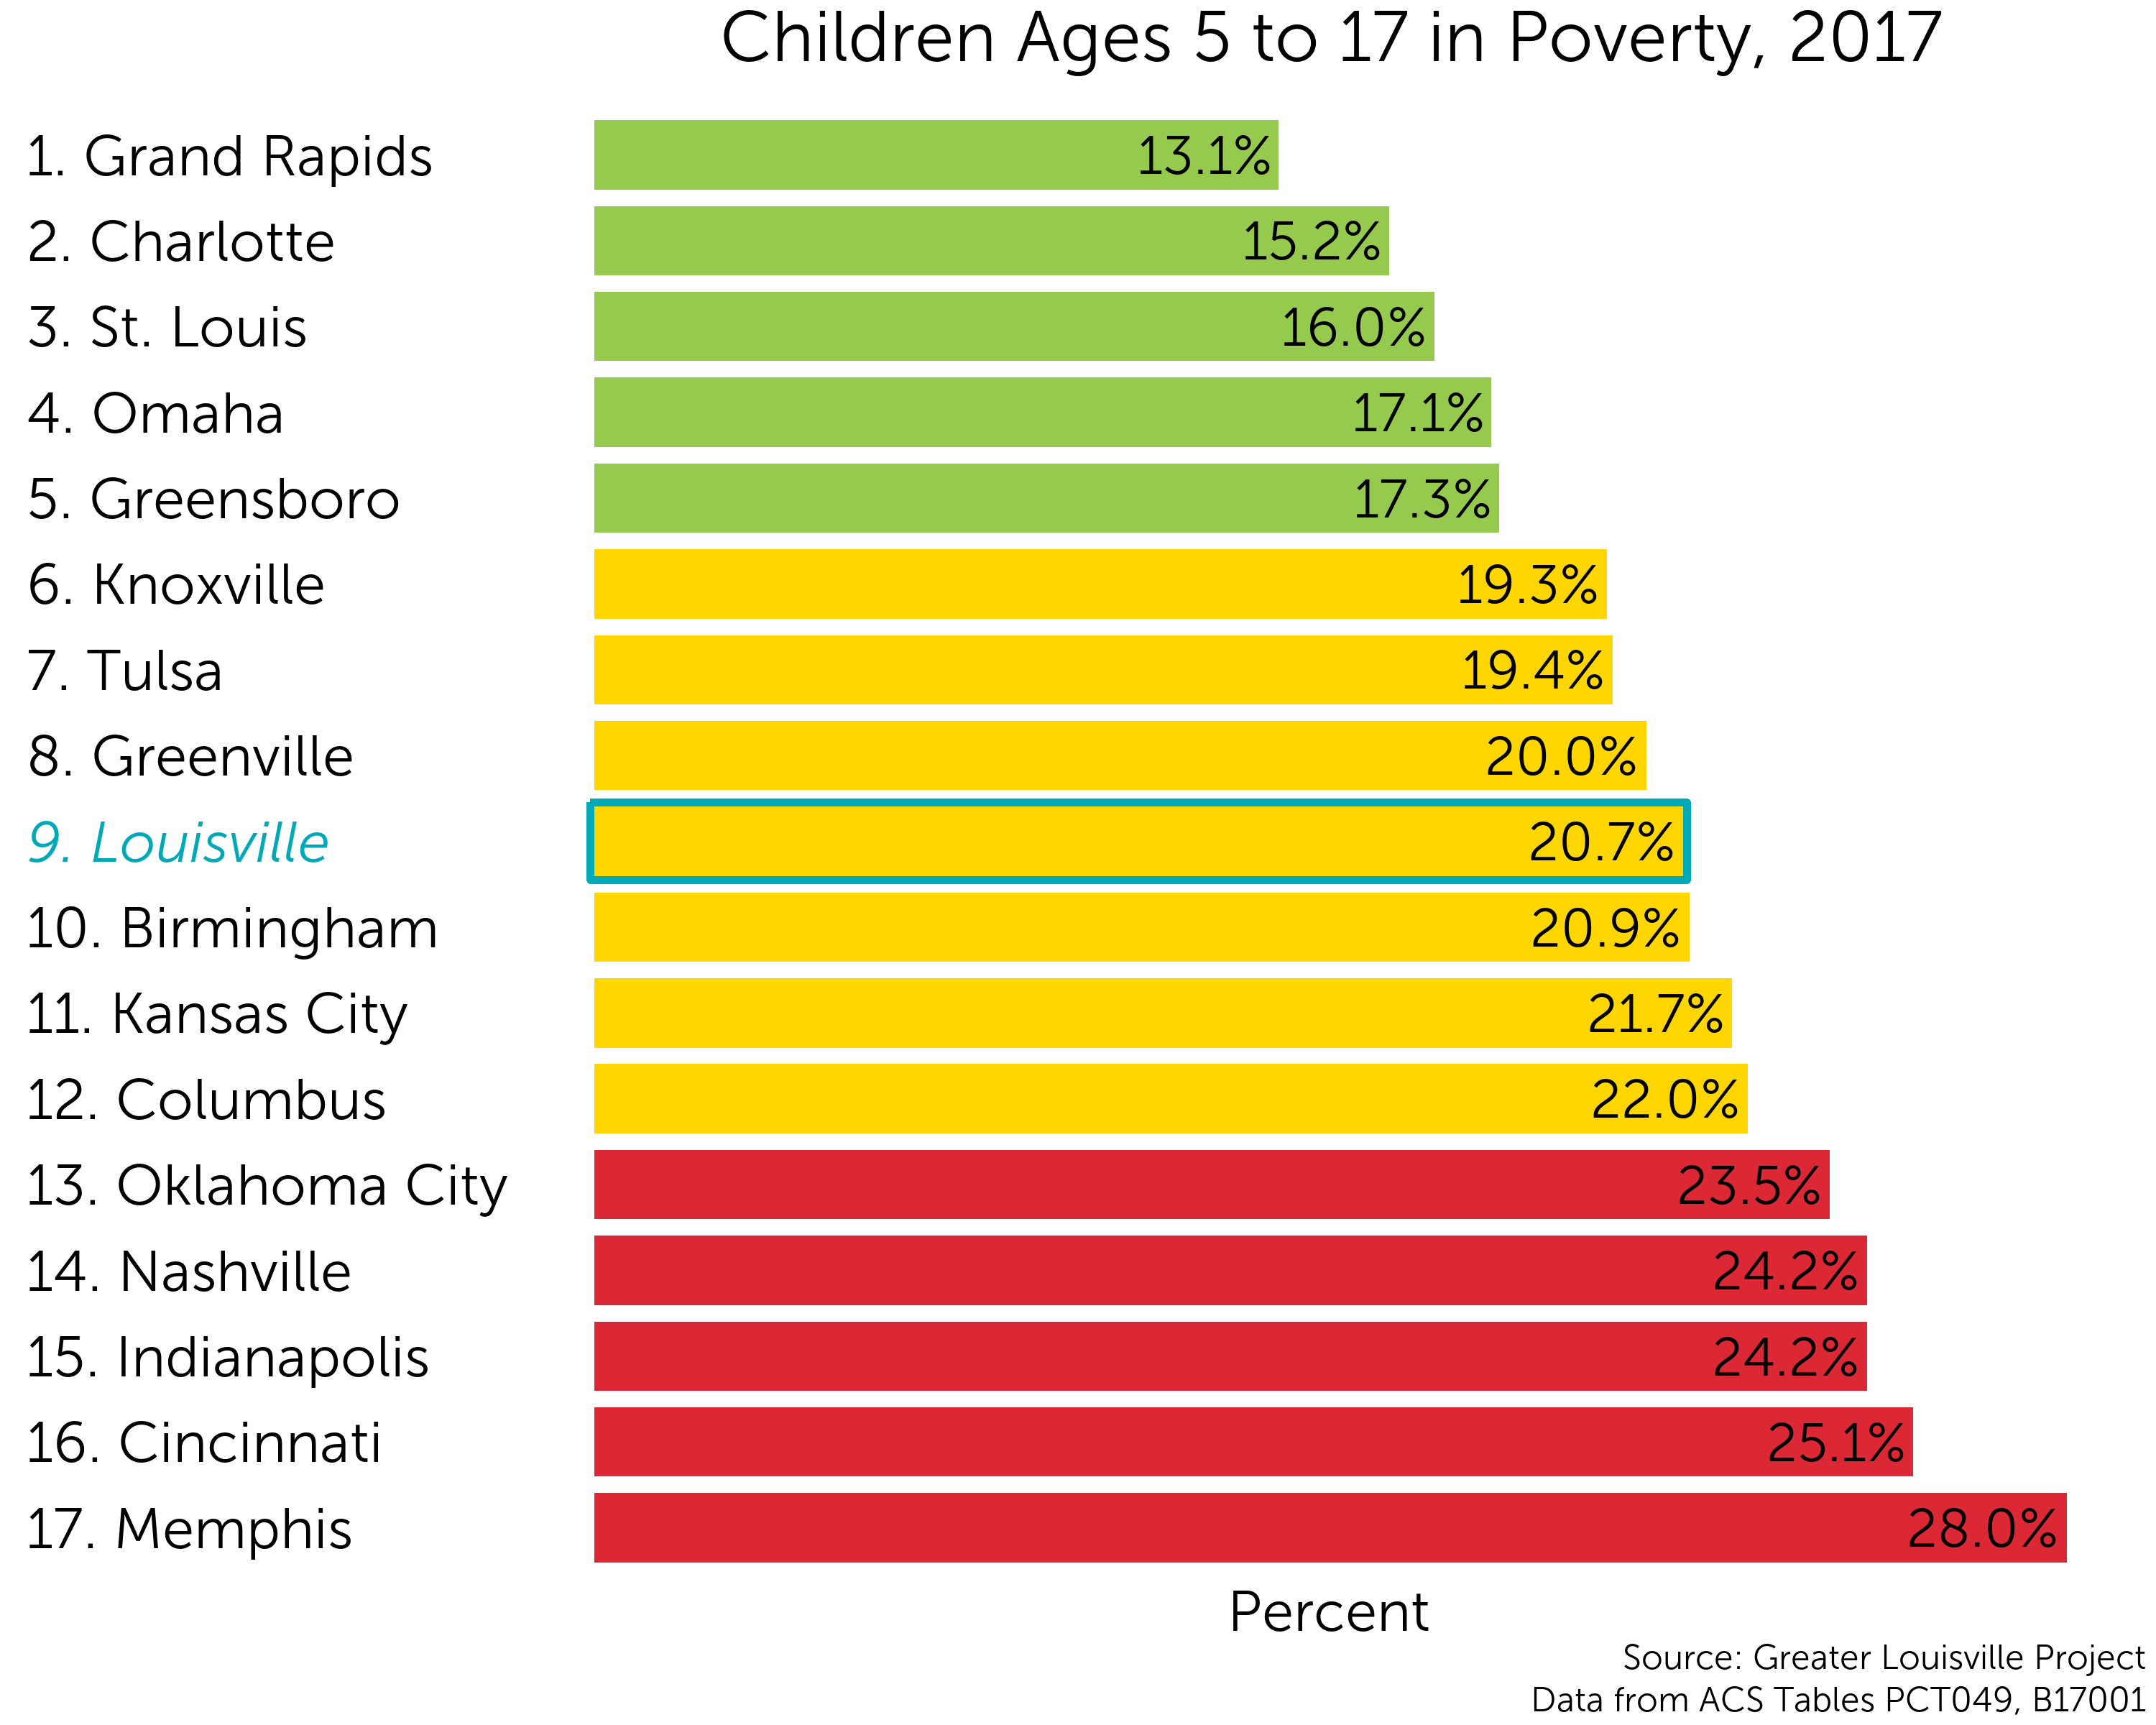
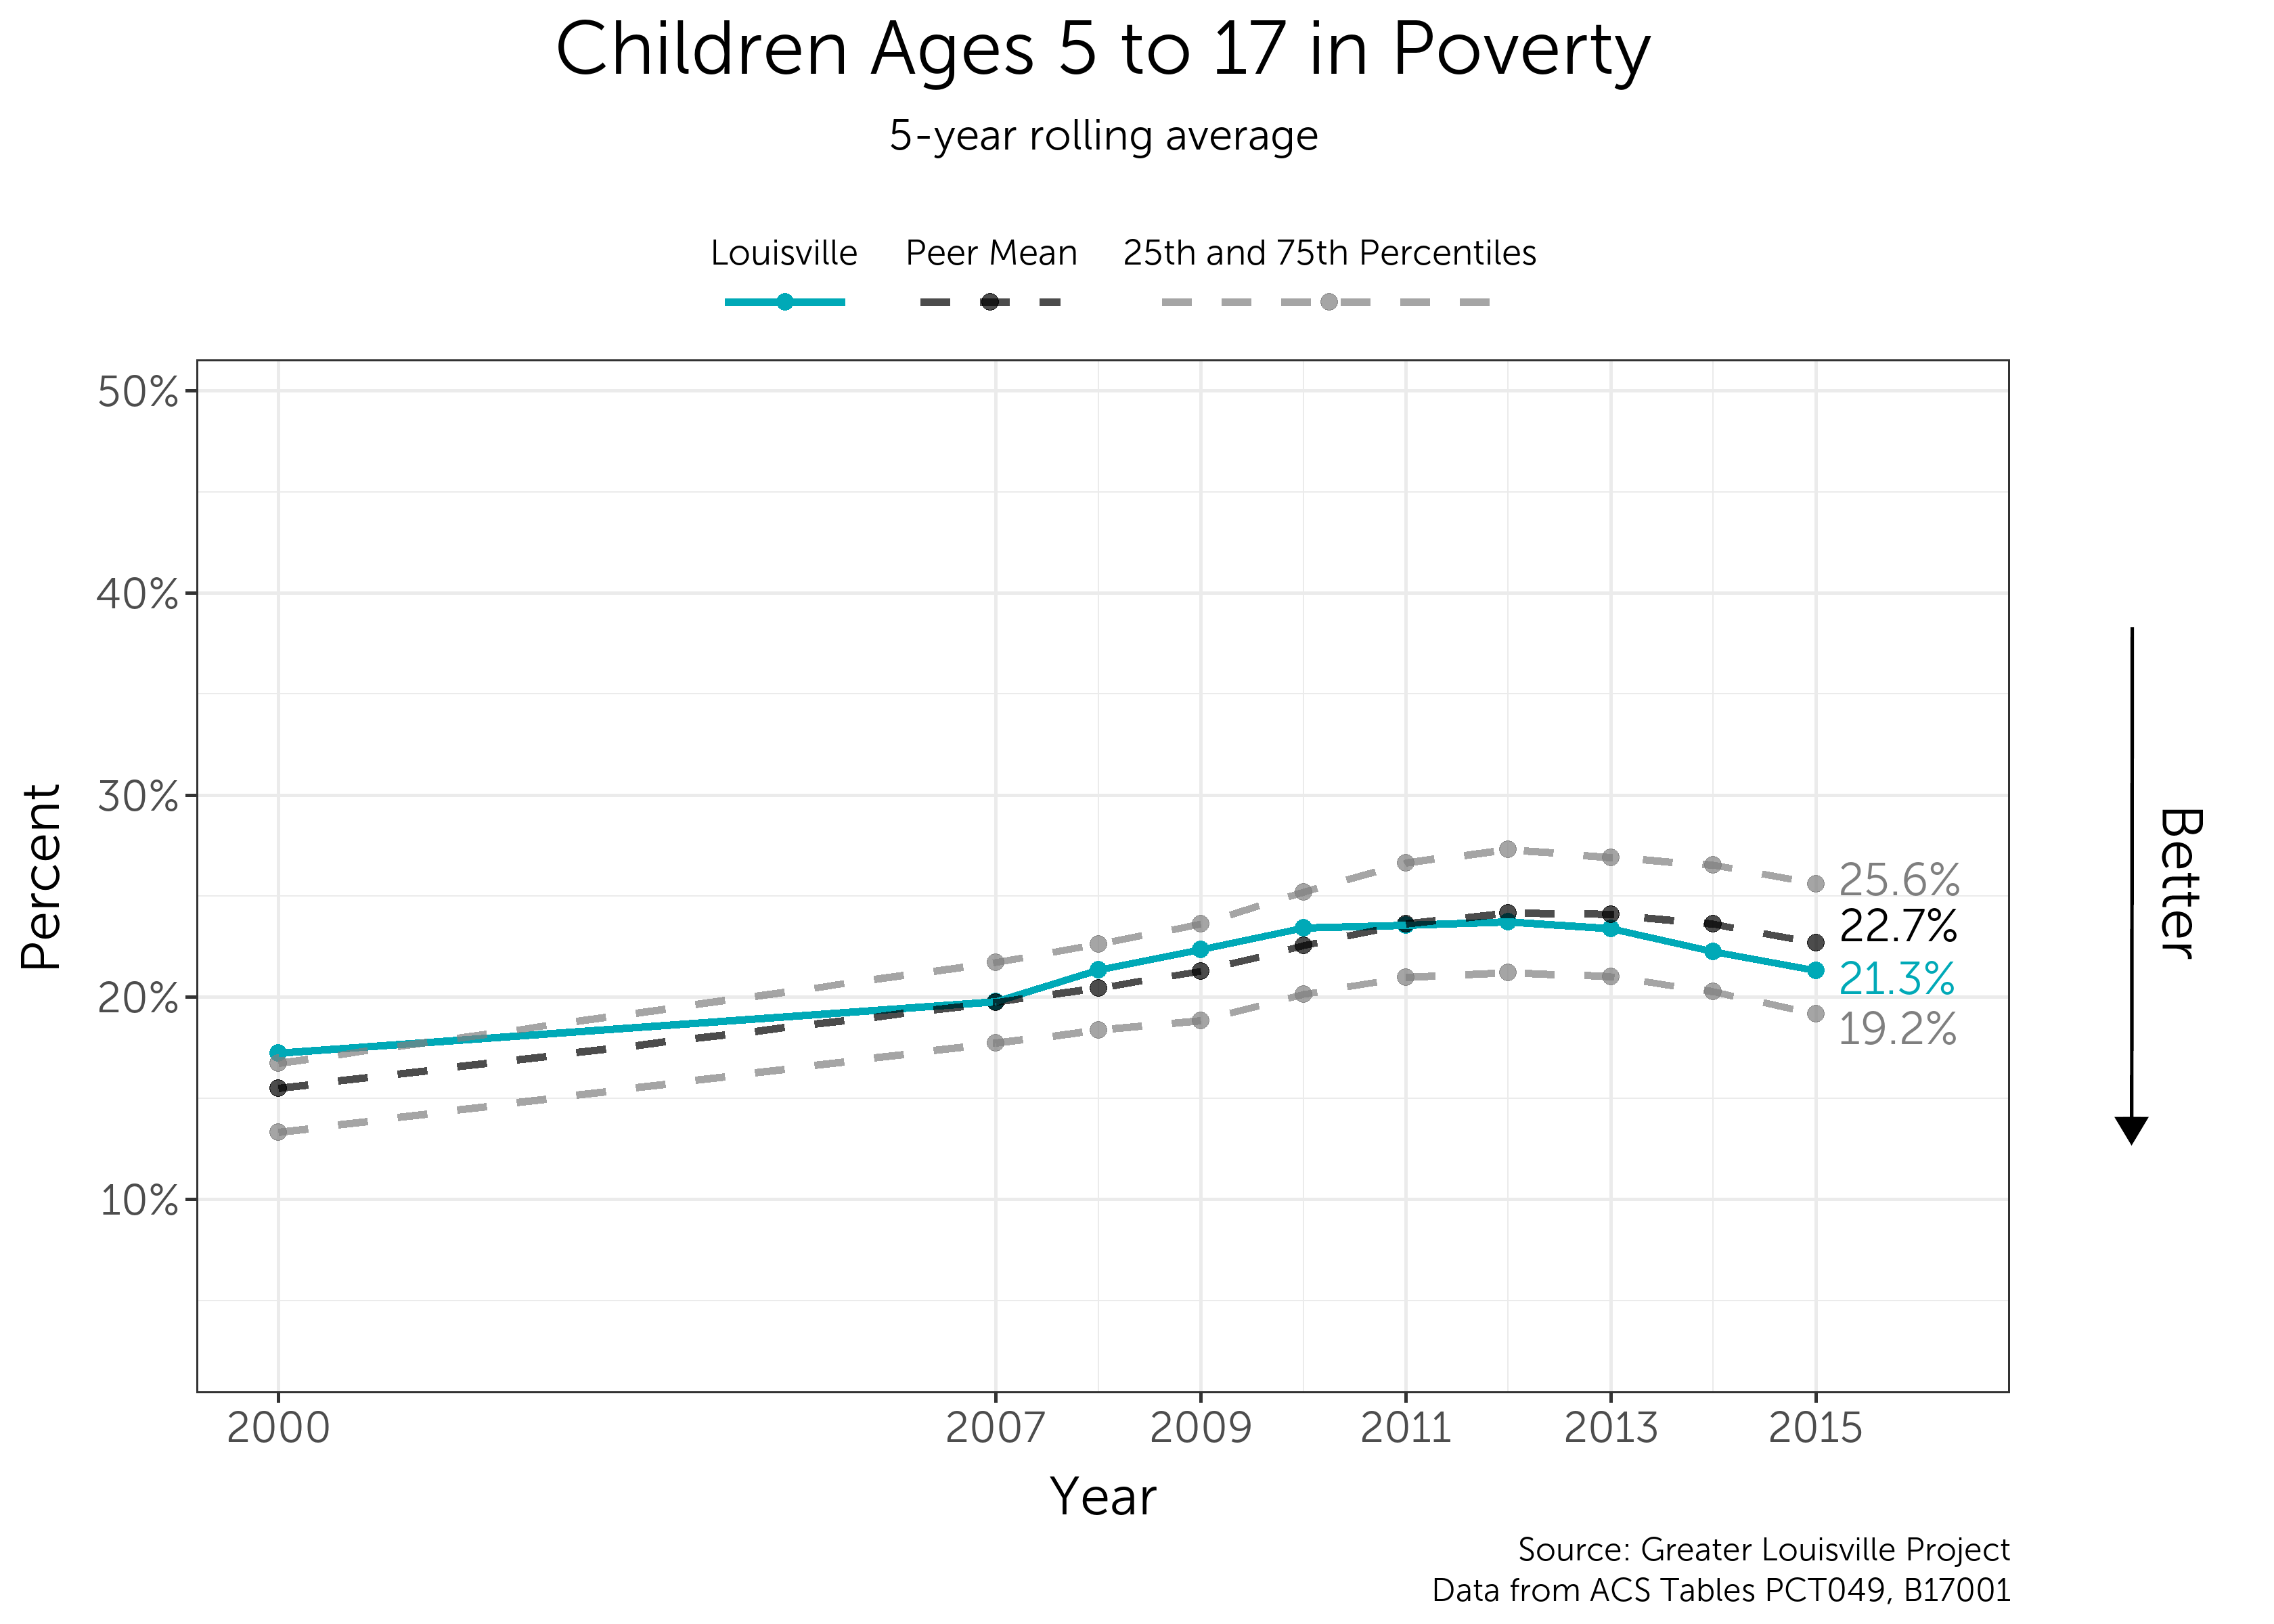
A quality education from kindergarten through high school is crucial for children to build a firm foundation for future education and a productive adult life. Many factors affect the quality of support children are given in and outside of school, thereby influencing the quality of education a child receives. In particular, poverty affects a students’ health, ability to focus, and ultimately, their educational success. The metric associated with K-12 success is “transition readiness,” in alignment with the efforts of 55,000 Degrees. Louisville has a target goal of 100% transition readiness among graduating high school students. The data below reflect students enrolled in public schools, and it describes whether they qualify as “transition ready” based on test scores and workforce credentials. More information on the definition of transition readiness can be found here.

Note: Kentucky changed the way readiness is measured between 2016 and 2017. Because of the differences between college and career readiness and transition readiness, data should not be compared from the two periods.

Trends Over Time

JCPS students perform well below the 25th percentile of KY public school students.

Note: Kentucky changed the way readiness is measured between 2016 and 2017. Because of the differences between college and career readiness and transition readiness, data should not be compared from the two periods.

Differences Based on Race

Neither JCPS nor the state of KY has progressed in reducing the gaps between racial groups for transition readiness. Asian and white students in JCPS and in KY public schools continue to perform higher in transition readiness compared to Hispanic and Black students in JCPS and across the state.

Note: Kentucky changed the way readiness is measured between 2016 and 2017. Because of the differences between college and career readiness and transition readiness, data should not be compared from the two periods.

Differences Based on Sex

Male and Female JCPS students have very similar transition readiness, though both groups perform very poorly compared to state averages.

Note: Kentucky changed the way readiness is measured between 2016 and 2017. Because of the differences between college and career readiness and transition readiness, data should not be compared from the two periods.

Differences Based on Free and Reduced Lunch Status

Within JCPS and within KY public schools, students who qualify for free or reduced lunch are less transition ready than their wealthier counterparts.

Note: Kentucky changed the way readiness is measured between 2016 and 2017. Because of the differences between college and career readiness and transition readiness, data should not be compared from the two periods.

Explore the Data by School

ACT Composite Score

The ACT is a standardized college admissions exam taken by students across the country. In Kentucky, every student enrolled in public schools takes the ACT during their junior year. ACT scores are a very important component of college applications, and high ACT scores can help students qualify for scholarships. Students’ performance on the ACT is reflective of both their general academic knowledge and their preparedness for the exam.

Trends Over Time

JCPS students currently sit at the 25th percentile of Kentucky students with a mean composite ACT score of 18.2. The KY public school mean composite score is 19.1.


Differences Based on Race

Overall, racial disparities have persisted since 2012. Both within JCPS and KY public schools, Black and Hispanic students receive lower composite ACT scores than their white and Asian counterparts. These gaps are not narrowing. A gap over over 5 points currently exists between Asian, the top performing group, and Black students, the bottom performing group.

Differences Based on Sex

There is almost a 1 point composite ACT score gap between females in JCPS (18.5) and females in KY public schools (19.4). Both males and females in JCPS continue to lag behind their state counterparts. Females in JCPS and in KY public schools receive higher composite ACT scores than their male counterparts.


Differences Based on Free or Reduced Lunch Status

Within JCPS and across KY public schools, students who do not receive free or reduced lunch receive much higher ACT scores. While the gap between JCPS and KY students not receiving free or reduced lunch is minimal, JCPS students on free and reduced lunch continue to fall behind their state counterparts.

Explore the Data by School

Public School Graduation Rate

The graduation rate is the percentage of high schoolers who obtain their high school diploma after four years of study. Matriculation from high school is very important for future success, as it opens the door to a much broader set of college and career opportunities than are available to those who do not graduate. Earnings are also much higher among high school and college graduates than those who drop out of high school. While five-year graduation rates are available, they are not very different than four-year rates. The data below pertain to students enrolled in public schools.

Trends Over Time

The JCPS graduation rate has increased to 82.3% since 2013. While this rate is trending in a positive direction, JCPS continues to lag behind almost all Kentucky public school districts.

Trends by Race

The graph shows that the gaps between racial groups and between JCPS students and KY public school students have not decreased since 2013.  Across all racial groups, KY public school students are graduating at higher rates than their JCPS counterparts.

Differences Based on Sex

The gap between males and females persists both in JCPS and in KY public schools. Male and female students in KY public schools are graduating at higher rates than their JCPS counterparts.  Across KY and in JCPS, females graduate at much higher rates than males.

Differences Based on Free or Reduced Lunch Status

Across Kentucky, students who are eligible for free/reduced lunch graduate at a lower rate than students who are not, however that is not true of JCPS, where students receiving free/reduced lunch graduate at a higher rate than their counterparts from families with higher incomes.

Explore the Data by School

Summer Melt

Summer melt is the percentage of students who file a Free Application for Federal Student Aid (FAFSA) but do not enroll in college within 12 months of high school graduation. It is an indicator of the number of students who have an interest in attending college but who, for various reasons, do not enroll.

Since 2008, there has been a large increase in summer melt. While the rapid increase in earlier years was likely a result of more students filling out the FAFSA, the increase over the last five years aligns with other data that show declining college-going among JCPS students.

Children Ages 5 to 17 in Poverty

Young children living in poverty experience unique barriers to food access, stable housing, employment, healthcare, and social support. These barriers can hinder a child’s ability to achieve academic success. In addition, children living below the poverty line may struggle with finding stable and substantial employment as adults.

Peer City Perspectives

Louisville currently ranks 9th among its peer cities in child poverty among older children, with 20.7% of children between the ages of 5 to 17 living in poverty. In 2017, the poverty line was $16,240 for a family of two and $24,600 for a family of four.

Louisville is in the middle of its peer group according to a natural breaks algorithm. Cities in green are those that outperform their peers, cities in yellow represent the middle cluster, and those in red are a group that lags behind its peers on this indicator.

Where is childhood poverty found in Louisville?

Although Louisville ranks 9th out of 17 cities in child poverty rates, child poverty varies substantially within the city. There are more children, ages 5-17, in poverty west of I-65. In the map to the left, areas with high rates of child poverty are purple, and areas with average to low rates are white.

Child poverty is most concentrated in Louisville’s western and downtown neighborhoods. Portland and Russel have the highest rates of child poverty at 67% and 66%. The lowest rates of child poverty are in Floyd’s Fork, the Highlands, and Northeast Jefferson.

Scroll over the map to see values for each census tract. Zoom in to see street names that form the boundaries of each tract.

Trend Over Time

The child poverty rate in Louisville has been steadily decreasing since 2011.  Until then, Louisville traditionally ranked in the bottom 50% of its peer cities. However, Louisville has been reducing child poverty at a faster rate than many of its peer cities over the past 5 years, and it is now ranked below the peer city mean. Concerted efforts to eradicate child poverty could create a foundation that would place Louisville in the top tier of cities for generations to come.

Comparison between the Most and Least Improved Peer Cities

The percentage of children ages 5 to 17 in poverty is currently higher in all peer cities than it was in 2000. Since the end of the Great Recession, child poverty in Louisville has decreased faster than the peer average. The most improved city since 2000 is St. Louis, which only saw an increase in child poverty among ages 5 to 17 of 2.5 percentage points. Poverty among children in Louisville increased by 4 percentage points over the same timeframe.

Differences Based on Race

There percentage of Black children ages 5 to 17 in poverty is almost four times as high as the percentage of White children ages 5 to 17 in poverty. This gap has persisted over time. Child poverty for ages 5 to 17 among both White and Black children is higher in Louisville than their respective peer means.

Differences Based on Sex

The percentage of female children ages 5 to 17 is below their peer mean, and male children are approximately at their peer mean. The percentage of males ages 5 to 17 in poverty is higher than that of females of the same age.