Social and Economic Factors

Research over the past 25 years has increasingly demonstrated the importance of the social determinants of health, encapsulated by social and economic health factors. This measure is a combination of community safety, education, employment, income, and family and social support. In addition to their strong connections to health behaviors and access to care, social and economic factors affect stress levels which have a strong bearing on mental and physical health. The social and economic factors measure is created by standardizing several components and then weighting them based on their importance.

Peer City Perspective

Louisville ranks 12th in terms of socioeconomic and health factors, ranking below the peer city average. This graph shows an index of health behaviors where the vertical black line represents this average. The bars represent how many standard deviations from average each city is.

Child Poverty

Young children living in poverty experience unique barriers to food access, stable housing, healthcare, and social support. In addition, they are at an increased risk of depression, intimate partner violence, and poor health behaviors as they grow older. As a result, children who grow up in poverty experience higher rates of illness and death than children who do not.

Peer City Perspective

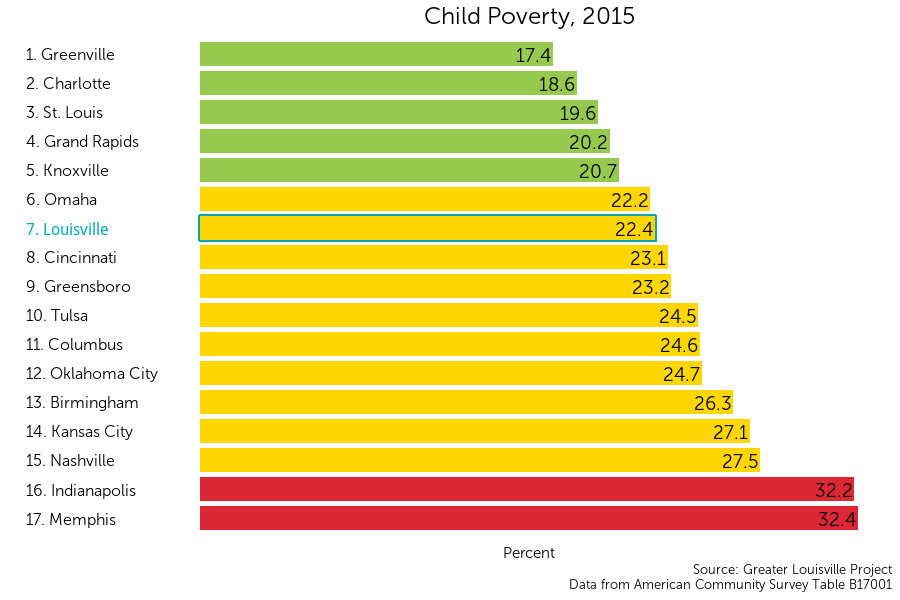
Louisville currently ranks 7th among its peer cities with 22.4 percent of children under the age of 18 living in poverty. The poverty line in 2015 was $15,930 for a family of two and $20,090 for a family of three.

Louisville is in the middle of its peer group according to a natural breaks algorithm. Cities in Green are a cluster that outperforms their peers, Yellow represents the middle cluster, and Red is a group that lags behind its peers on this indicator.

Where is childhood poverty found in Louisville?

Although Louisville ranks 7th out of 17 cities in child poverty rates, child poverty varies substantially within the city, ranging from 67% in some neighborhoods to 4% in others. In the map to the left, areas with higher rates of child poverty are purple, and areas with lower rates are white.

Child poverty is most concentrated in Louisville’s western and downtown neighborhoods. Russell, California, Smoketown, and Park Hill are several neighborhoods with particularly high rates of child poverty. The lowest rates of child poverty are in Floyd’s Fork, the Highlands, and Northeast Jefferson.

Scroll over the map to see values for each census tract. Zoom in to see street names that form the boundaries of each tract.

Trends Over Time

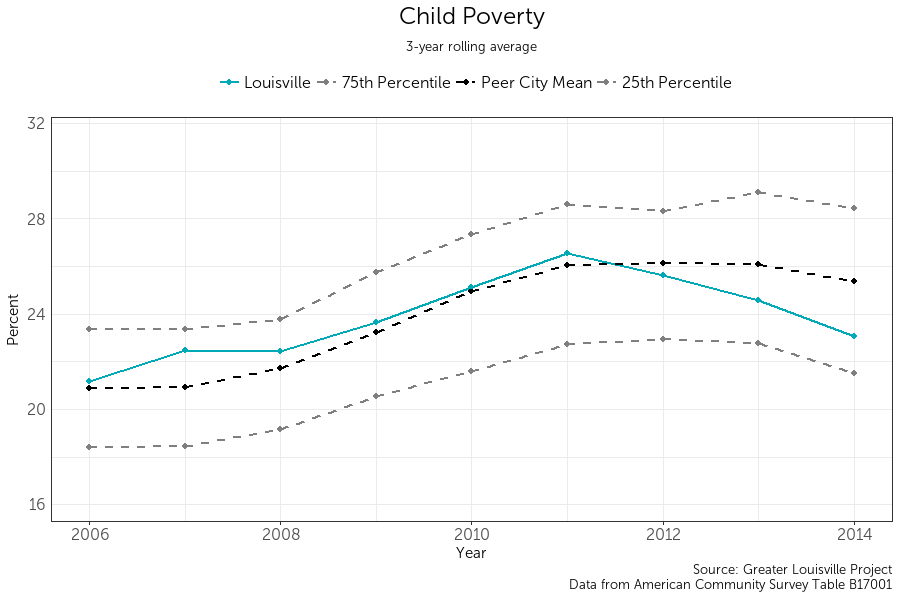
The child poverty rate in Louisville has been steadily decreasing since 2011. Until then, Louisville traditionally ranked in the bottom 50% of its peer cities. However, Louisville has been reducing child poverty at a faster rate than many of its peer cities over the past 5 years, and it is now ranked just outside the top 25% of its peer cities. Concerted efforts to eradicate child poverty could create a foundation that would place Louisville in the top tier of cities for generations to come.

Social Associations

Strong and supportive social networks help residents to be resilient during difficult times. Social associations are a useful proxy for social capital, networks of relationships and trust among people in a community. Social capital is a particularly important resource for people living in multidimensional poverty who have limited access to many other resources. Social connections can help those in poverty find solutions for the problems they face obtaining transportation, child care, and housing.

Peer City Perspective

Louisville currently ranks 14th among its peer cities with approximately 10 associations per 10,000 residents.

Louisville is in the bottom tier of its peer group according to a natural breaks algorithm. Cities in green are those that outperform their peers, cities in yellow represent the middle cluster, and those in red are a group that lags behind its peers on this indicator.

Trends Over Time

The rate of social associations relative to the population in Louisville was steadily decreasing from 2000 to 2011 but has remained relatively constant between 2011 and 2017. This decreasing trend is similar to the overall trend observed in Louisville’s peer cities, although Louisville has fallen below the 25th percentile of its peers.

Comparison between the Most and Least Improved Peer Cities

Since 2000, Grand Rapids saw its number of membership organizations remain constant, while the number of membership associations in Greensboro decreased greatly.

Violent Crime

While violent crime has serious and immediate impacts on its victims, its effects permeate through the whole community. Violent crime is harmful to mental health, it deters people from healthy behaviors like outdoor exercise, and it is detrimental to community-building. Violent crime is a result of a wide variety of factors, including poverty and household instability.

Peer City Perspective

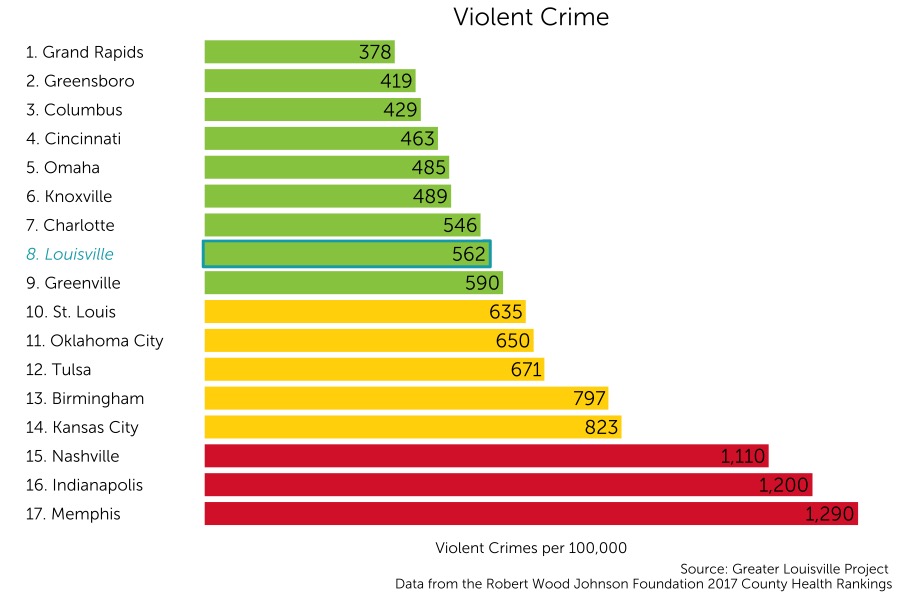
Louisville currently ranks 8th among its peer cities with 562.5 violent crimes per year per 100,000 people.

Louisville is in the top tier of its peer group according to a natural breaks algorithm. Cities in green are those that outperform their peers, cities in yellow represent the middle cluster, and those in red are a group that lags behind its peers on this indicator.