Community Progress Reports
The Greater Louisville Project seeks to mobilize key stakeholders across sectors to focus on the areas of highest potential impact to our community’s success. By leveraging data and benchmarking against our peer cities in our Competitive City Reports, the GLP helps establish a shared community agenda and common metrics for long-term progress
A Note on Data and Equity
The GLP’s definition of community success includes the success of all community members. It is vital that our city’s progress as a whole does not mask important disparities. Whenever possible, the GLP analyzes and highlights trends along racial, geographic, and gender lines in addition to measures of overall community progress.

2023: Safer City by Design
This report examines historic funding and the importance of investment in violence prevention by Metro Government, the state of youth homicide and the alarming increase of youth who are neither working nor in school since the start of the pandemic, and the upcoming “funding cliff” that violence intervention programs will face when ARP funds run out at the end of 2024.
2022: Gender Equity
An analysis of women’s basic economic security and access to affordable housing in Louisville created in partnership with the Louisville Metro Government Office for Women.

2022: Food Security
A report connecting growing food deserts and an increasing cost of living to hunger in Louisville.
2020: Measuring A Path Forward
A series of mini reports that align with specific issues addressed in A Path Forward.
2019: The Flow of Community Investment
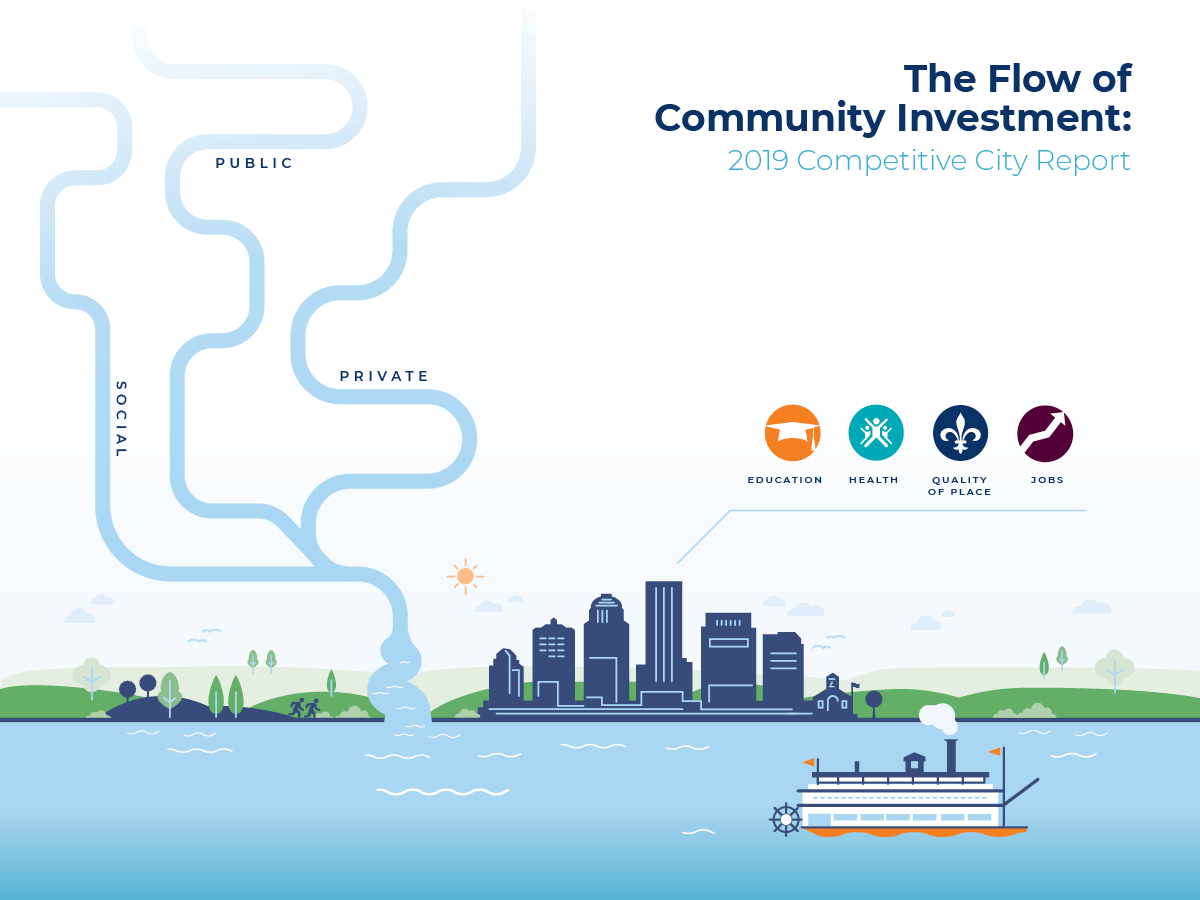
An analysis of the resources being invested in the Louisville community across the social, public, and private sectors.

2018: 15 Years Beyond Merger
An analysis of Louisville’s progress in each of the Deep Drivers of Competitiveness over the past 15 years since the Greater Louisville Project was founded at the time of Merger between city and county governments.
2017: Poverty Beyond Income
An examination of the interconnected barriers that keep households in poverty, preventing generations of children from realizing their potential and Louisville from becoming a more competitive city.
2015: Focus on Poverty
A measure of poverty beyond income both within Louisville and in comparison to its peer cities, drawing a clear connection between levels of concentrated poverty and the city’s overall competitiveness.

2014: Peer Cites Update
In 2014 The Greater Louisville Project released a new list of peer cities, updating a list first created in 2004. Benchmarking our Deep Drivers against our peers allows Louisville to see our progress as a community relative to other communities like us across the country. This enables us to hold ourselves accountable for the work we are doing to create a more competitive city.

2013: Building a Healthier Louisville
A review of how health, encompassing many facets beyond illness alone, impacts opportunity for educational attainment, the creation and retention of 21st Century Jobs, and ultimately our quality of place.

2013 Competitive City Update
An examination the types of degrees and jobs that are most critical to growth in an Innovation Economy, forwarding the plan to move Louisville’s industrial portfolio toward the top tier of its peers.
2012 Competitive City Update
An update of Louisville’s standings in terms of Education and Quality of Place, and our progress as a regional hub for high-quality 21st-century jobs, charting a plan to move Louisville to the top tier its peers.
2011 Competitive City Report
Exploring a “Decade of Data” as we bring the first decade of the 21st century to a close, celebrating Louisville’s performance and considering our potential for a future as a more competitive and compassionate community.

2010 Competitive City Report
A focus on Louisville’s advancements and standing among its peers across the Deep Drivers of Change, prompting a closer look at the communities disproportionately impacted by the economic downturn and the subsequent hindrances on their potential for success.
Digging Deeper: Education Attainment, Louisville Metro
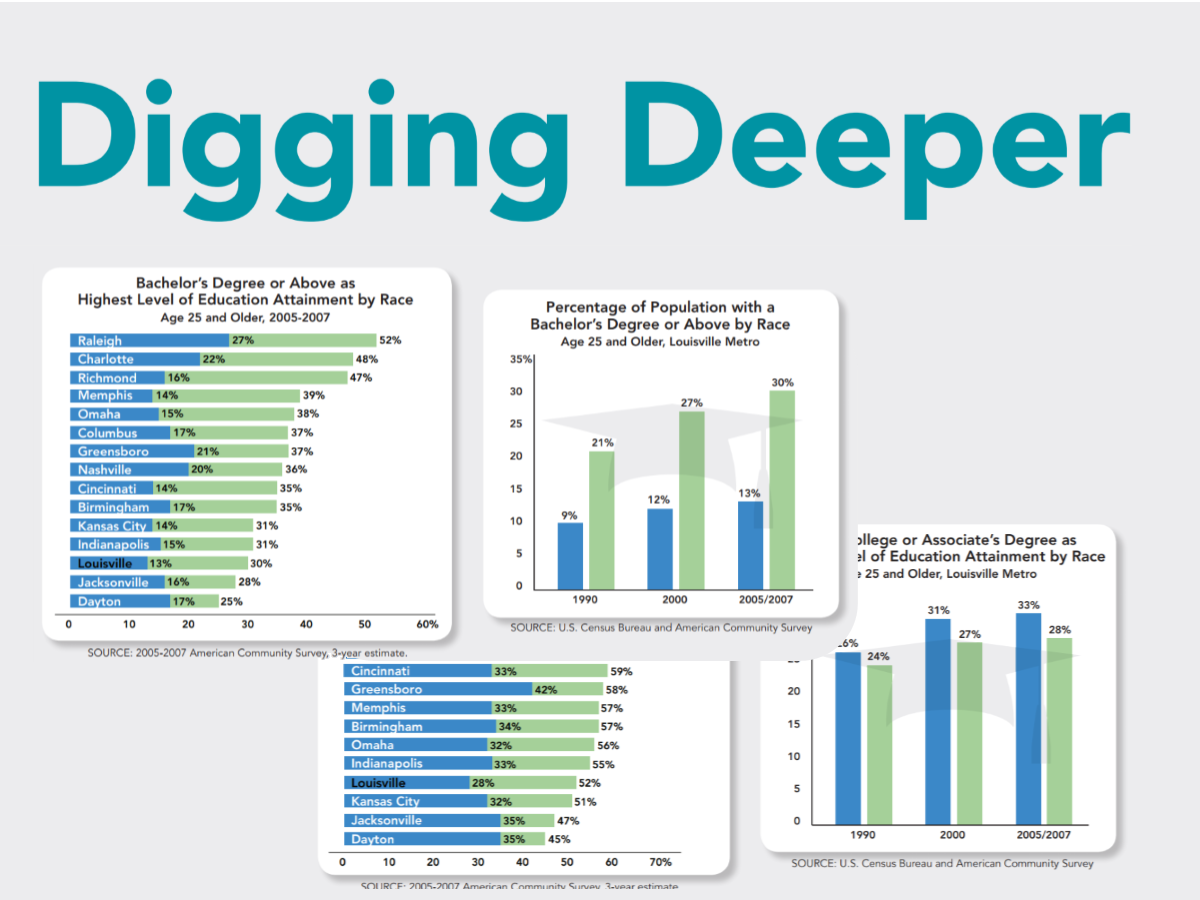
A deeper analysis into the data on our educational attainment, identifying missing pieces and illuminating the challenges to date, calling for a better understanding of work to increase overall educational achievement for our communities.

Education Pipeline
A framework for the education pipeline in Jefferson County and following educational attainment and success in all areas from birth through college, outlining how addressing gaps on our education pipeline can prepare Louisvillians for lifelong success in a 21st-century economy.

2009 Competitive City Report
A focus on the urgency of change following the nationwide economic crisis, promoting resilience and economic stamina, and promoting investment in our Deep Drivers of change to help Louisville thrive as a regional hub among the top of our peer cities.
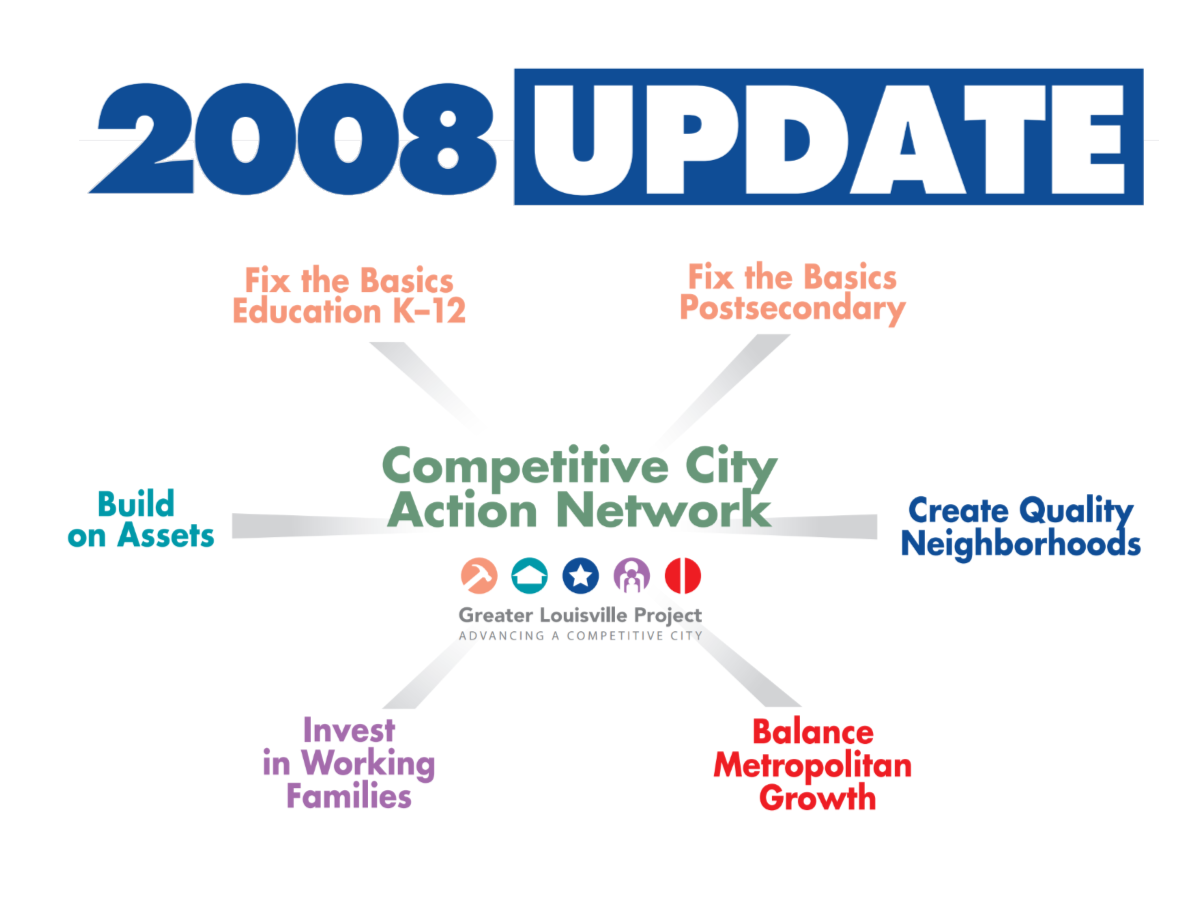
2008 Competitive City Update
An update on our community’s standing in regards to our previously identified Deep Drivers of Change, inciting motivation for action and promoting the realization of our goals within those critical areas of focus.

2007 Competitive City Report
An analysis of the socioeconomic measures of education, jobs, and growth in hopes of strengthening the community’s competitive standing by 2010.

2005 Competitive City Report

Beyond Merger
An exploration of an integrated view of the Louisville/Jefferson County merger, providing a framework for considering Louisville’s potential as we evolved from the 64th to the 16th largest city in the US.
Natural Breaks Algorithm
For each indicator, Greater Louisville Project assigns cities into one of three groups (high-performing, middle-of-the-pack, and low-performing) based on how they compare to other cities. The assignment is based on how cities naturally cluster on that indicator. Sometimes, the differences between cities are very small, and the difference between a city ranked 5th and 6th could simply be a matter of the sampling error that arises from using survey data. Thus, rather than always make a division that declares the top 5 to be the top tier, we use a natural breaks algorithm to look for a cluster of cities that is outperforming the rest, a cluster that is about average, and a cluster that is lagging. This clustering gives us a better indication of where Louisville is thriving and where Louisville has room to learn from cities that are doing better.
Z-Scores
Z-scores (or standardization) is a way to combine data with different units of measurement into a single index. The z-score is a measure of how far away a city (or census tract, etc.) is from the average city. In order to be comparable across different units of measurement, the z-score is the distance from the mean measured in standard deviations (e.g. if Louisville has a z-score of 1 it means Louisville is 1 standard deviation above the mean of its peer cities).
Data from the Robert Wood Johnson Foundation's County Health Rankings use z-scores and all z-scores are relative to the mean of Louisville's peer cities. (On the County Health Rankings site z-scores are relative to all the counties in each state - thus z-scores reported by GLP will be different, because we are using a different reference group). The Greater Louisville Project also uses z-scores in our multidimensional poverty index, which compares each census tract to the mean of all census tracts in Louisville.
