Unemployment

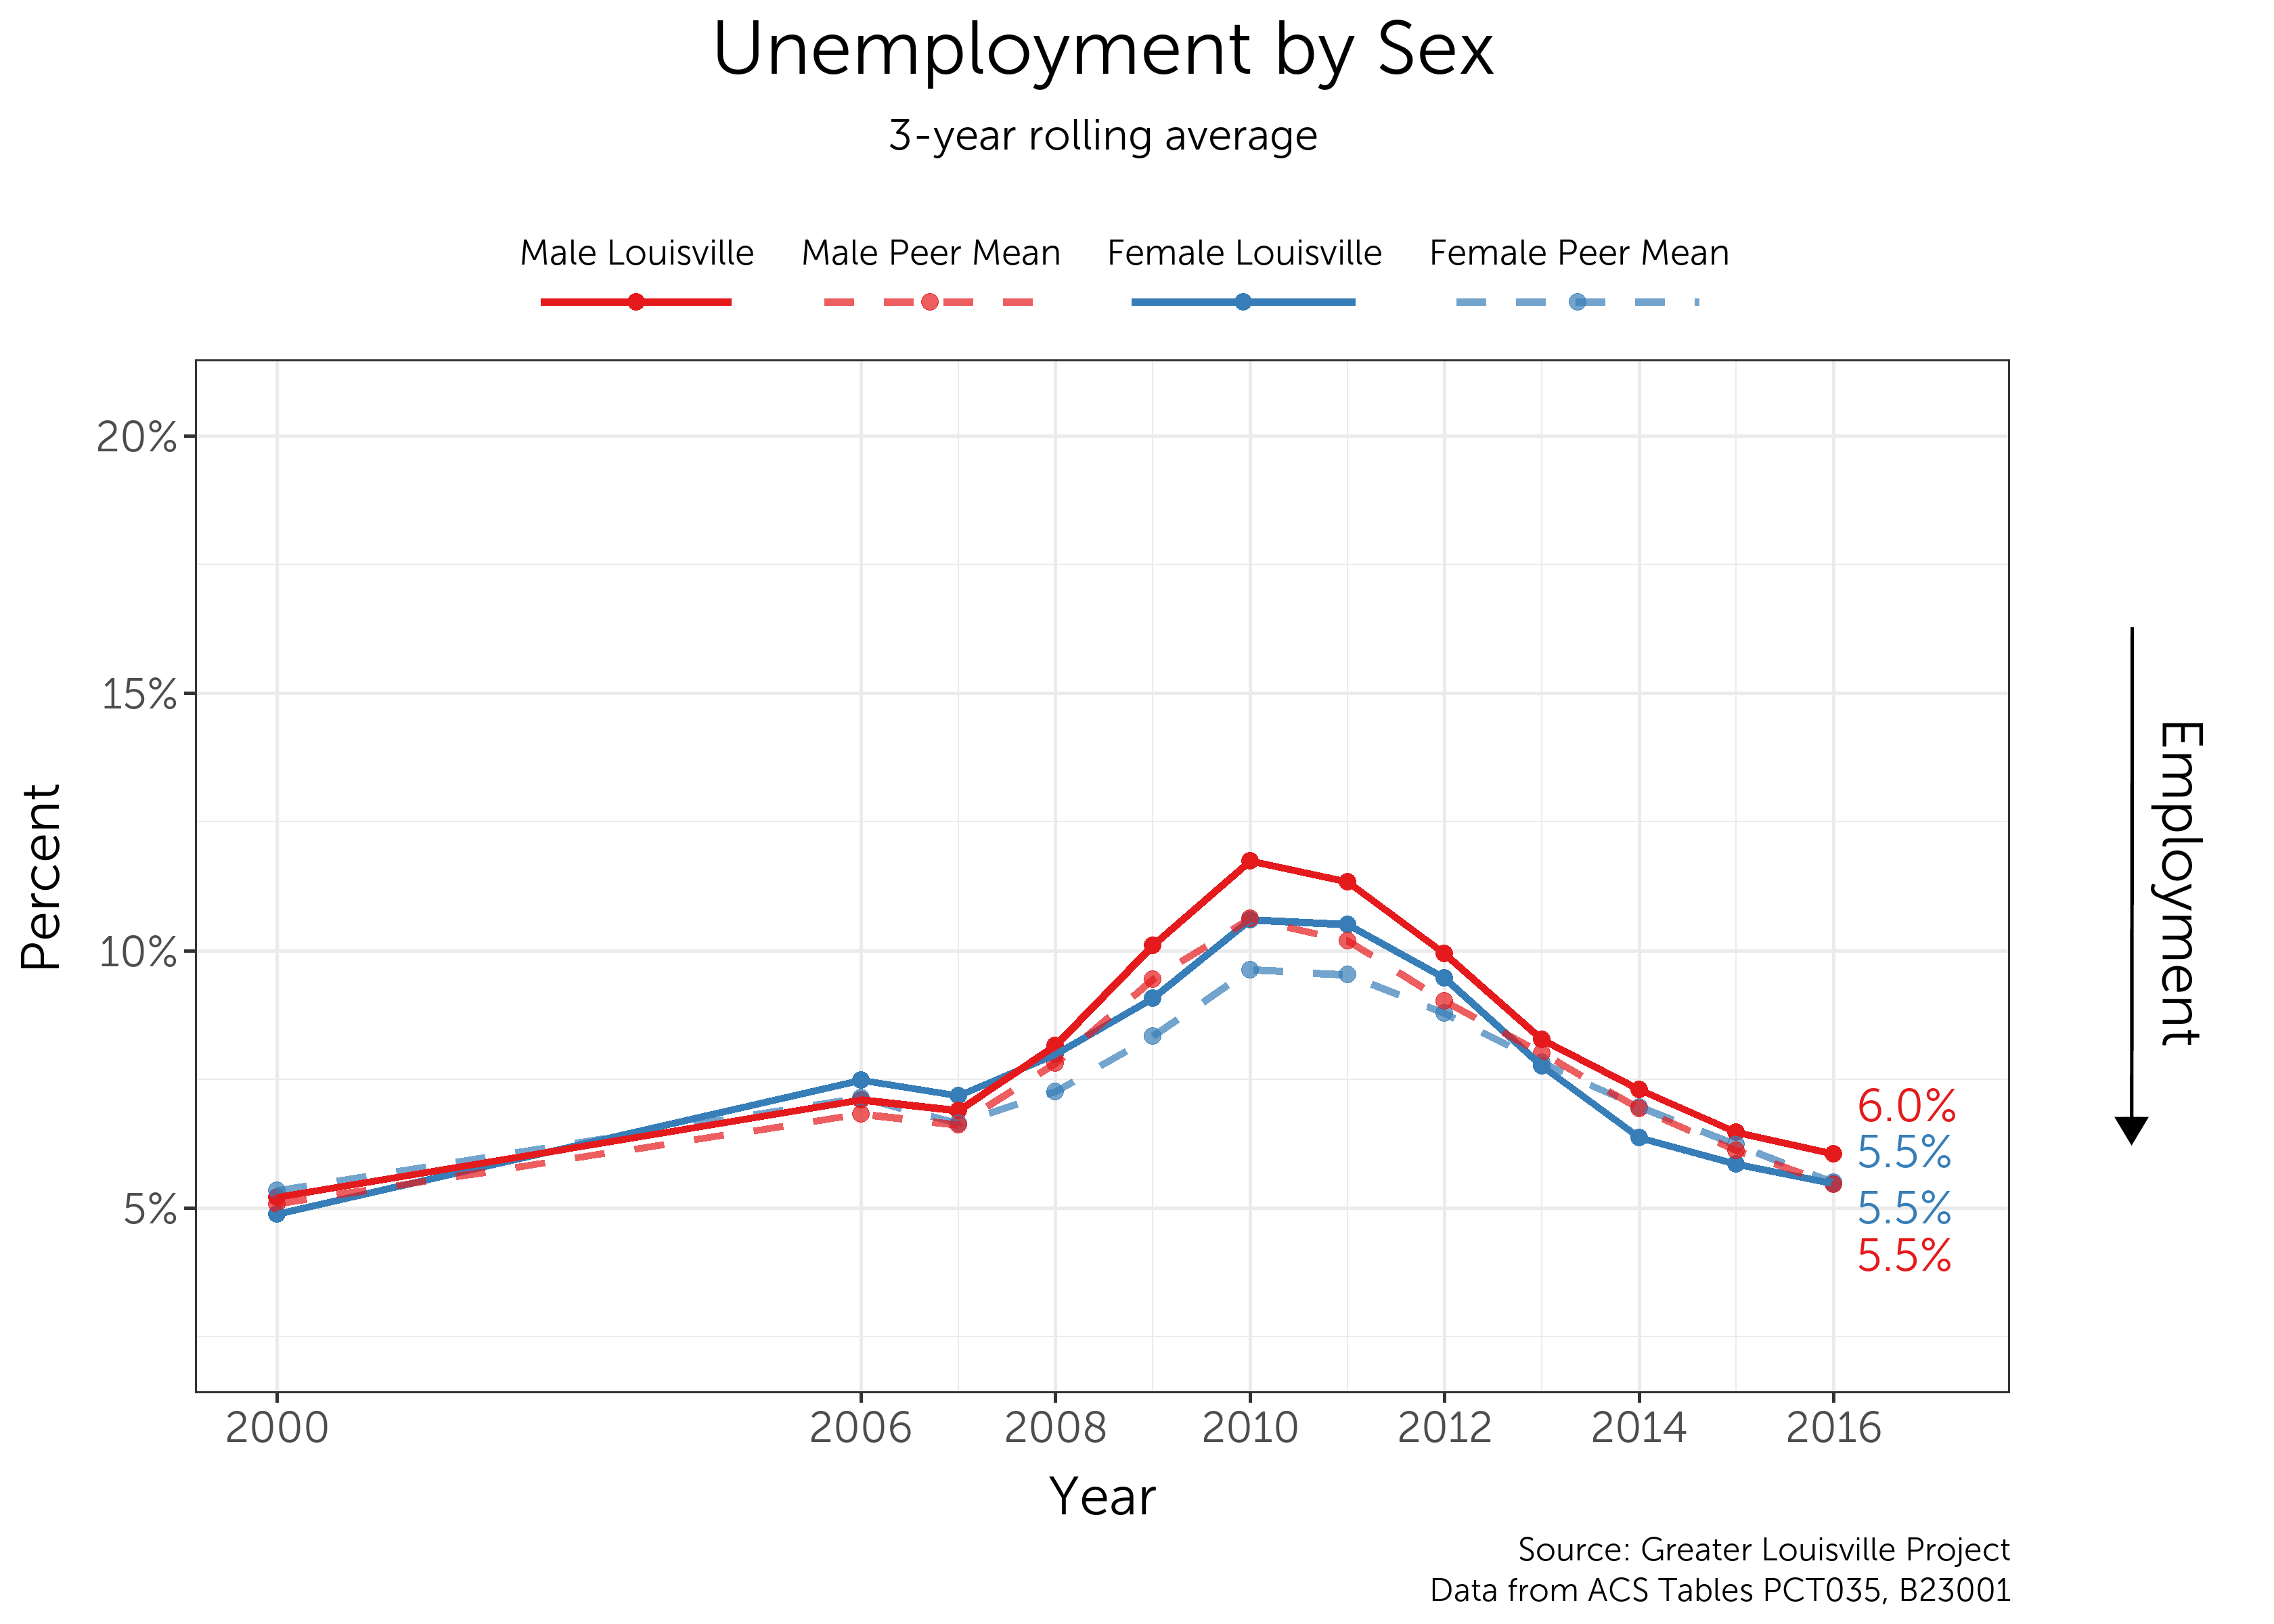
The unemployment rate of a given economy is a key economic indicator of labor market performance. When workers are unemployed, their households lose wages and the economy as a whole loses that individual’s contribution to the economy in terms of goods and services that they would have otherwise produced. Keeping the unemployment rate at a reasonably low level is key to creating a prosperous Louisville.

Peer City Perspective

Louisville currently ranks 12th among its peer cities in rates of unemployment with an unemployment rate of 5.6%. According to the Bureau of Labor Statistics, an individual is considered unemployed when they are actively searching for employment but are unable to find work.

On this metric, Louisville sits in the middle of its peer group according to a natural breaks algorithm. Cities in green are those that outperform their peers, cities in yellow represent the middle cluster, and those in red are a group that lags behind its peers on this indicator.

How does unemployment vary across Louisville?

Although Louisville ranks 12th out of 17 cities in unemployment, there is tremendous variation across the city. In the map to the left, areas with lower levels of unemployment are displayed in white, and areas with higher levels of unemployment are displayed in purple.

Floyd’s Fork and areas near the airport show the lowest unemployment rate of 2.8%.  Fern Creek, St. Matthews,  and Northeast Jefferson County have unemployment rates of 3.1%, 3.3%, and 3.8%, respectively. The Russel neighborhood shows a substantially higher unemployment rate of 26.1%. This rate is the highest of all Louisville neighborhoods.

Scroll over the map to see values for each census tract. Zoom in to see street names that form the boundaries of each tract.

Trends Over Time

Unemployment in Louisville has steadily decreased since it peaked in 2010 at 11.2%. Since then, Louisville consistently had a rate of unemployment higher than its peer city average. As of 2016, the city’s unemployment rate was at 5.8%, above the peer city mean, but below the 75th percentile.

Comparison Between the Most and Least Improved Cities

The least improved peer city, Tulsa, had relatively low levels of unemployment during the Great Recession but has struggled to continue reducing unemployment in line with peer cities in recent years. Nashville is the most improved peer city with an unemployment rate of 4.4%. The average unemployment rate in peer cities decreased from a high of 10.1% in 2010 to 5.5% in 2016.


Differences Based on Race

Across peer cities, Black residents continue to experience higher unemployment rates than Whites. In 2016, the unemployment rate among Black Louisville residents was about three times the unemployment rate among white Louisville residents. While the unemployment rate for White residents in Louisville has been declining since 2010, the rate for Blacks increased from 2015 to 2016. The unemployment rate for White Louisvillians decreased from above the 75th percentile of peer cities during the Great Recession to the peer mean in 2016. The rate for Black Louisvillians has remained consistely above their peer mean near the 75th percentile.

Differences Based on Sex

Since 2009, Louisville males have had a higher unemployment rate than Louisville females. The unemployment rate for Louisville males is slightly above their peer city mean, while the rate for Louisville females is at their peer city mean.