![]()
![]()
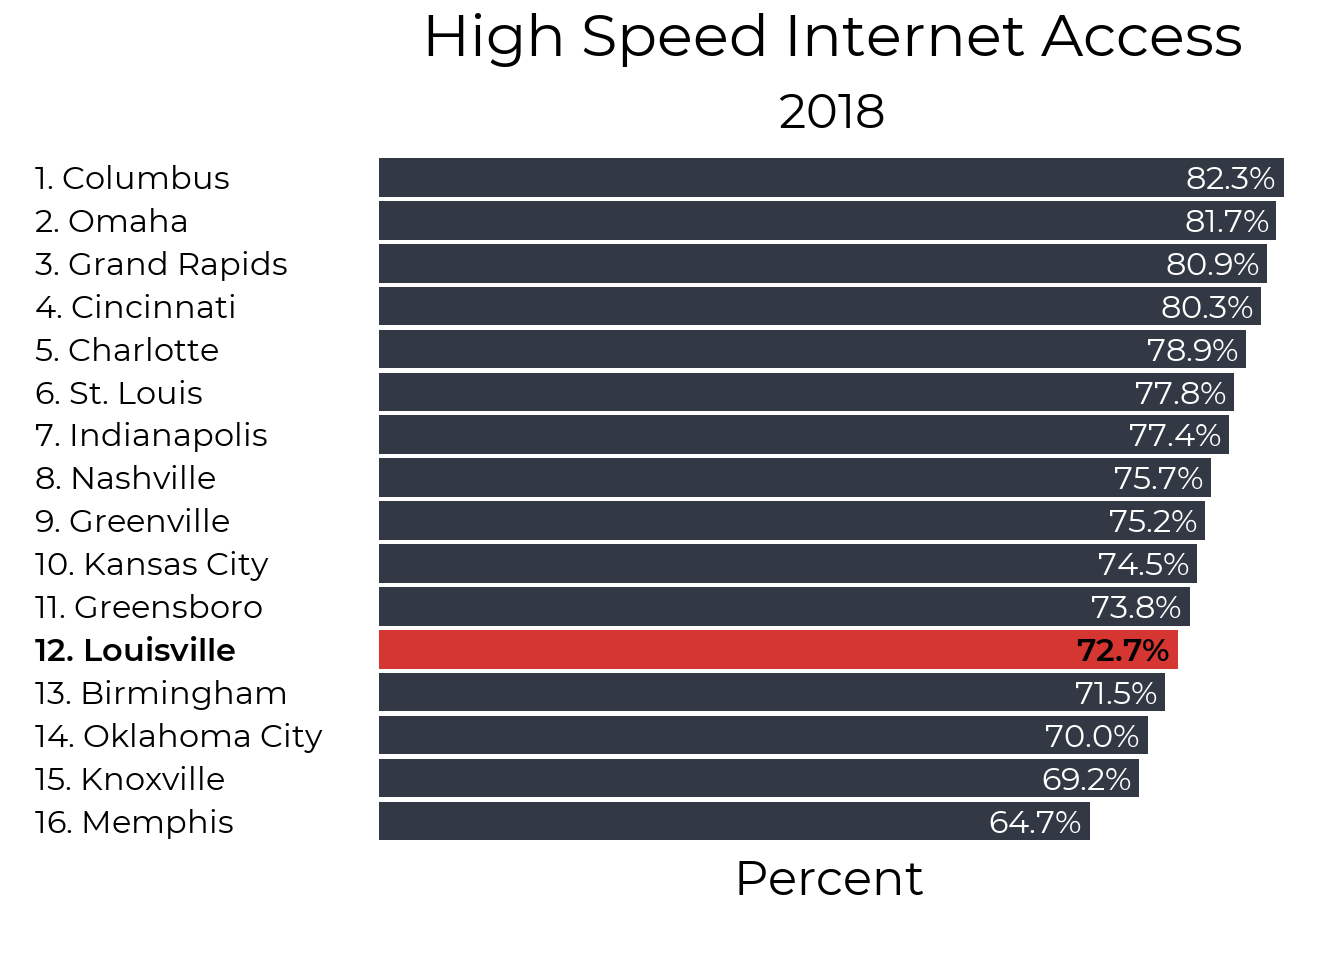
Our focus on internet access is a focus on high speed access. While internet access over a smartphone or other non-high speed source can be useful for staying connected, in the COVID era of working and learning from home, high speed internet is a necessary utility that over a quarter of our households do not have. While 91% of houses have some form of internet access, only 73% have high speed internet access.
Other key takeaways from this report: About 1 in 10 households in Louisville have no internet access, and 3 in 10 do not have the high-speed access necessary for working and learning at home. Access to high-speed internet access has not improved in the past 6 years. Households also lack access to devices, with 15% of houses not having a computer or a tablet.
This report uses census Microdata from IPUMS to look at internet access in the Louisville MSA from 2013 to 2018. Houses that do have computers or tablets may not have enough devices for multiple people working and learning from home (the number of devices is not available in the data).
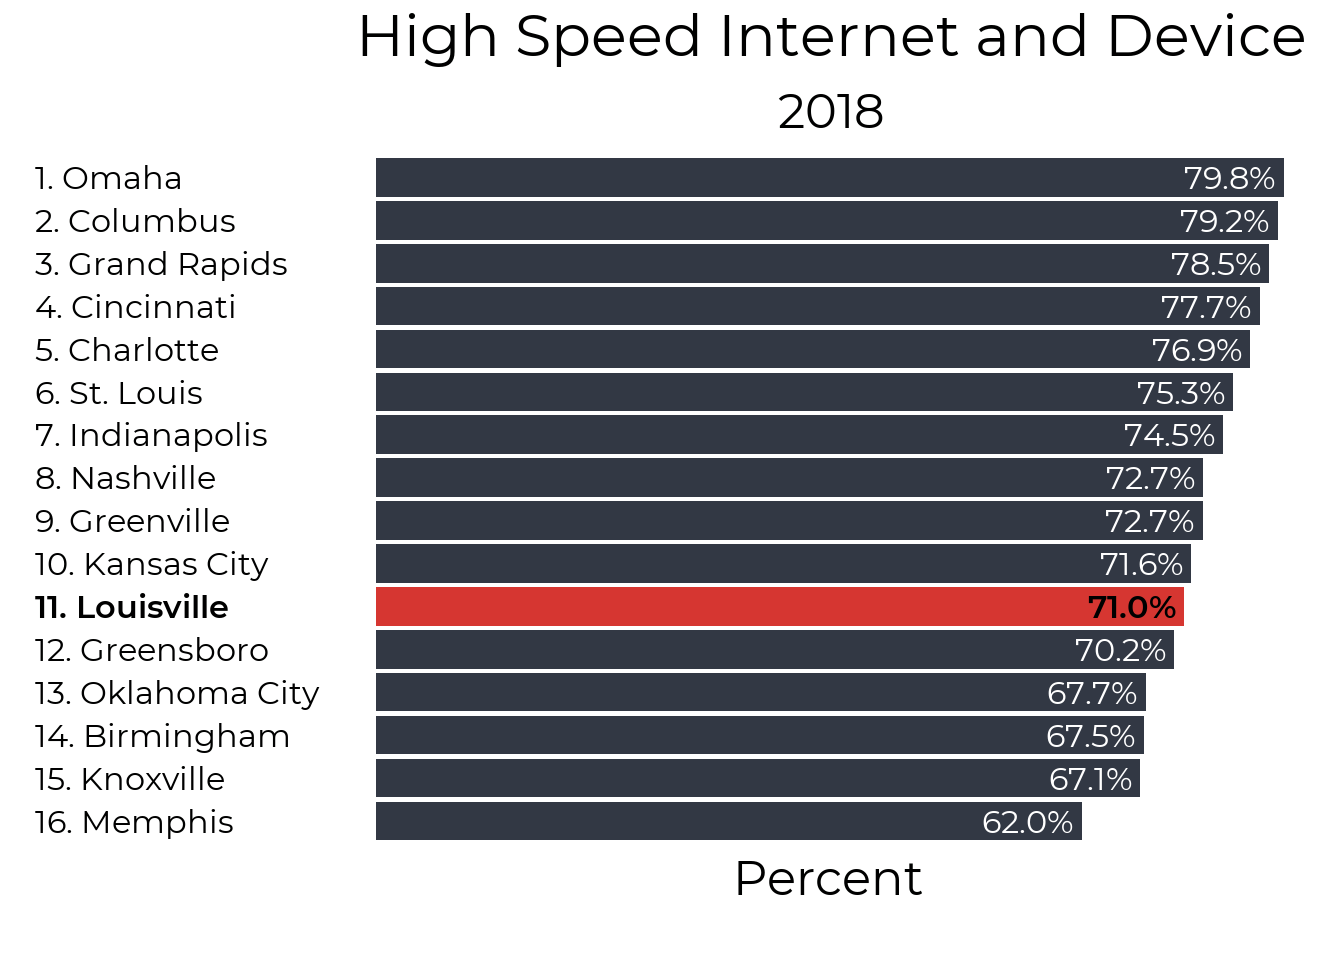
Our research prioritizes access to high speed access and a device other than a phone such as a computer or tablet. While internet access over a smartphone or other non high speed source can be useful for staying connected, in the COVID era of working and learning from home, high speed internet is a necessary utility that over a quarter of our households do not have. While 91% of houses have some form of internet access, only 71% have high speed internet access and access to a device.
A full 27% percent of households do not have access to the internet at home. This is fairly similar to the numbers with high speed internet, suggesting that most people with high speed internet do have at least one device capable of accessing it.
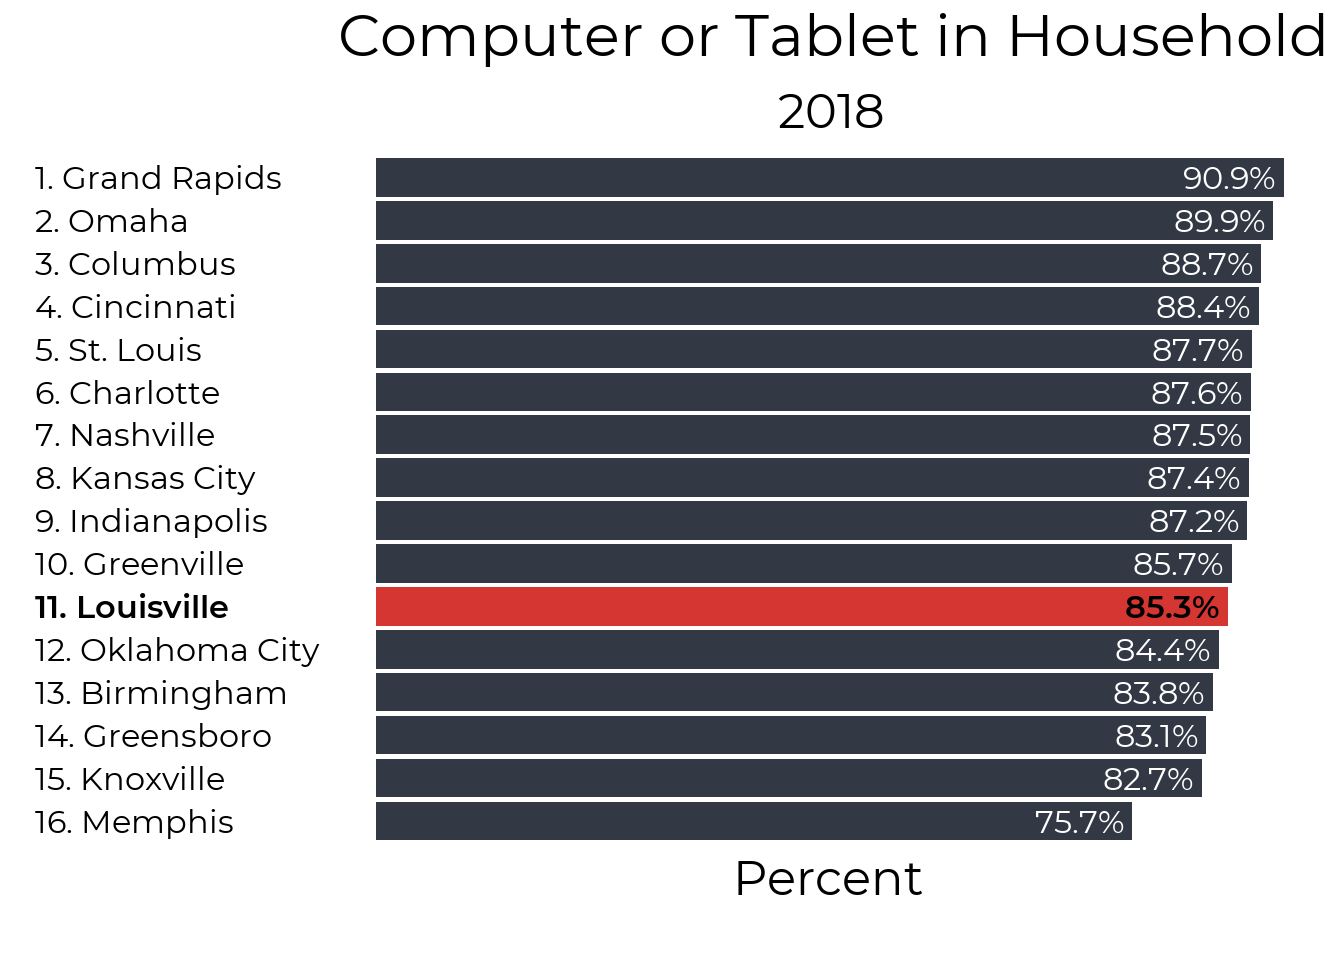
A full 15% of our households do not have either a computer or tablet at home, and this understates the extent of the internet device shortage, as a single device is insufficient for a household with multiple people working and learning.
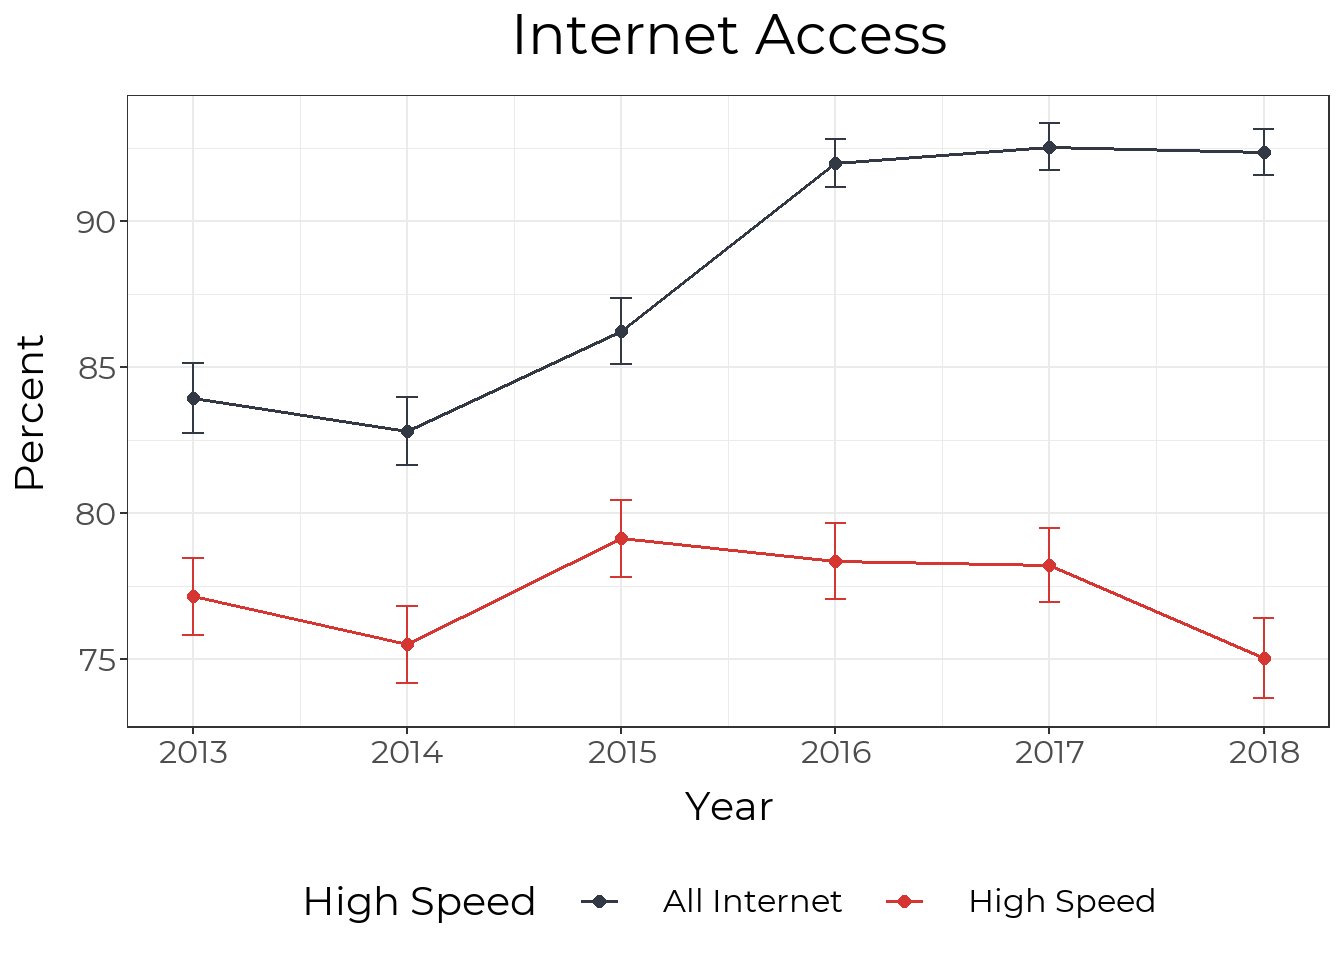
Growth in high speed internet access was nearly flat through 2018, with clear disparities by race and income.
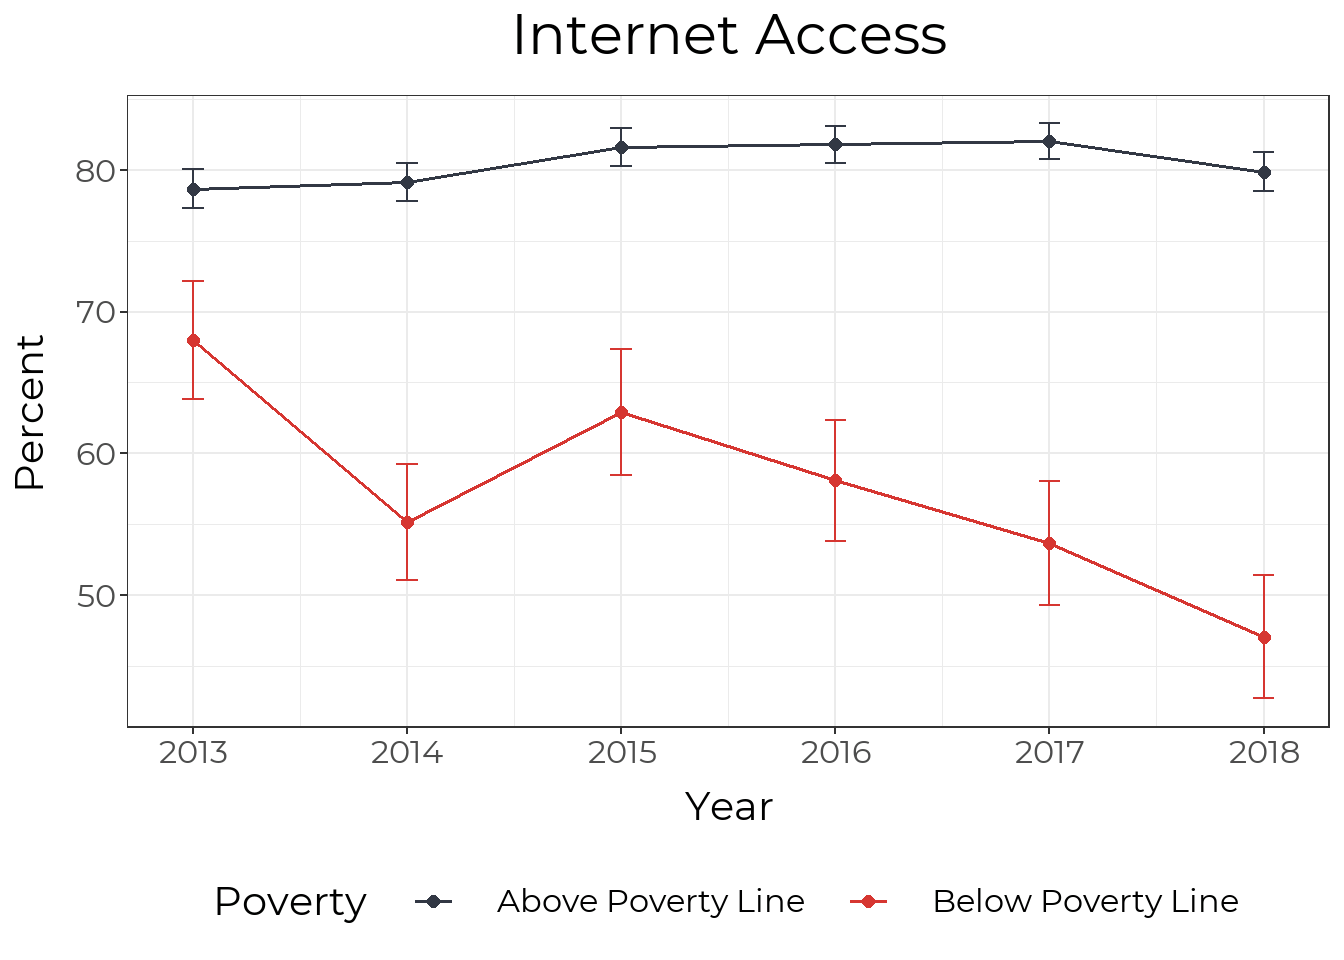
While our focus is on high speed access, we do show the history of both all internet access and high speed access in the graph below. Although overall internet access has increased a little since 2013, high speed internet access remains flat or possibly slightly below 2013 levels. In 2016, the Census Bureau began asking about smart phones for the first time. Although the internet access question was not changed, the addition of the question about smartphones may still explain the jump in consumers reporting that they had internet acess at home. There is no similar uptick in high speed access.
HIgh speed internet access for households in poverty has been decreasing since 2013.
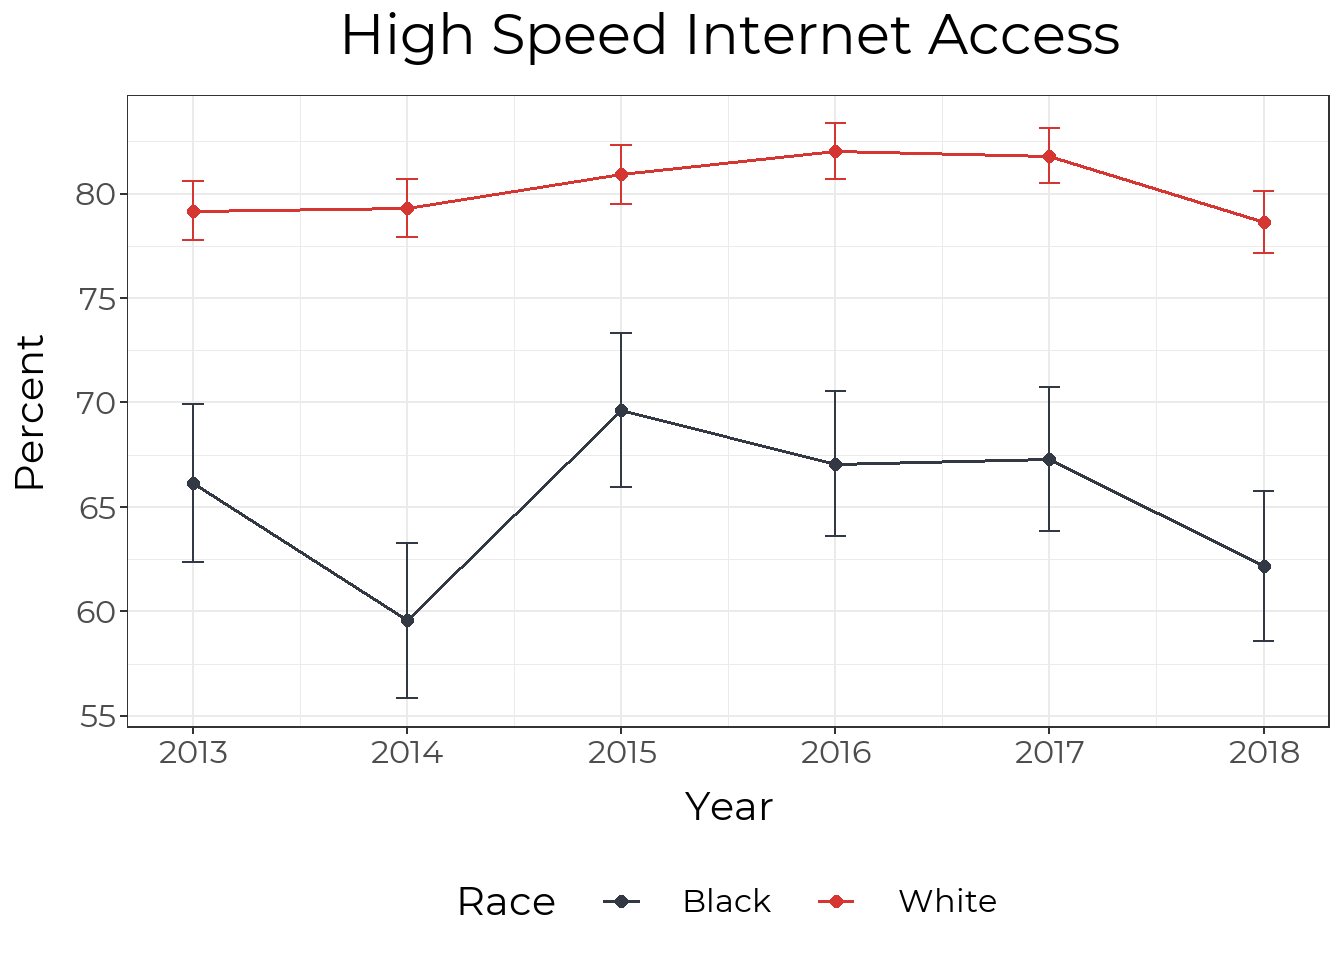
High speed internet access has either remained steady or slightly declined for Black households in Louisville.
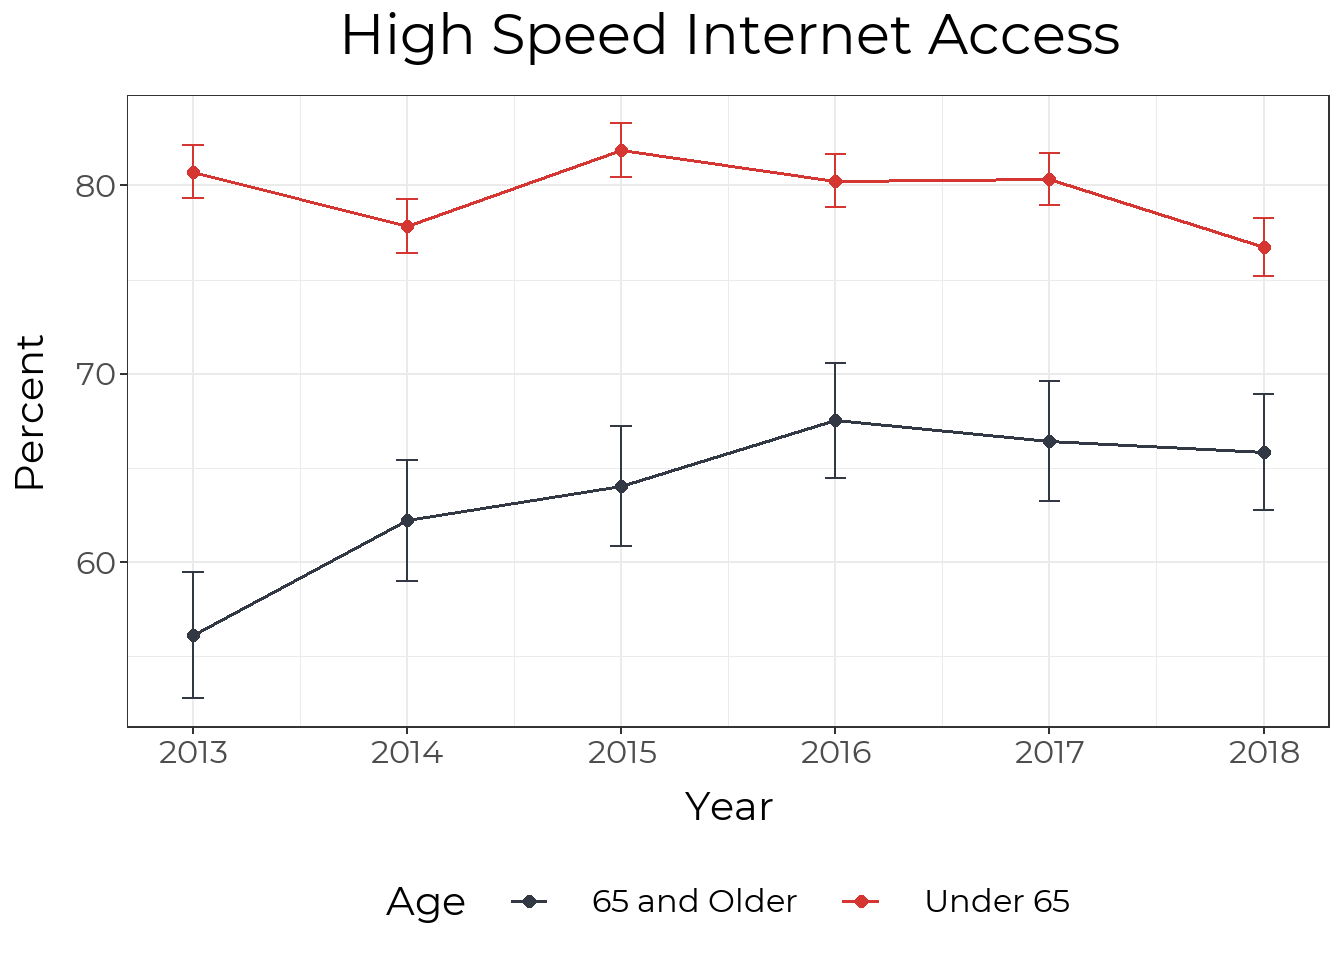
Households with adults age 65 and older is one of the only household groupings where high speed internet access has actually increased over time
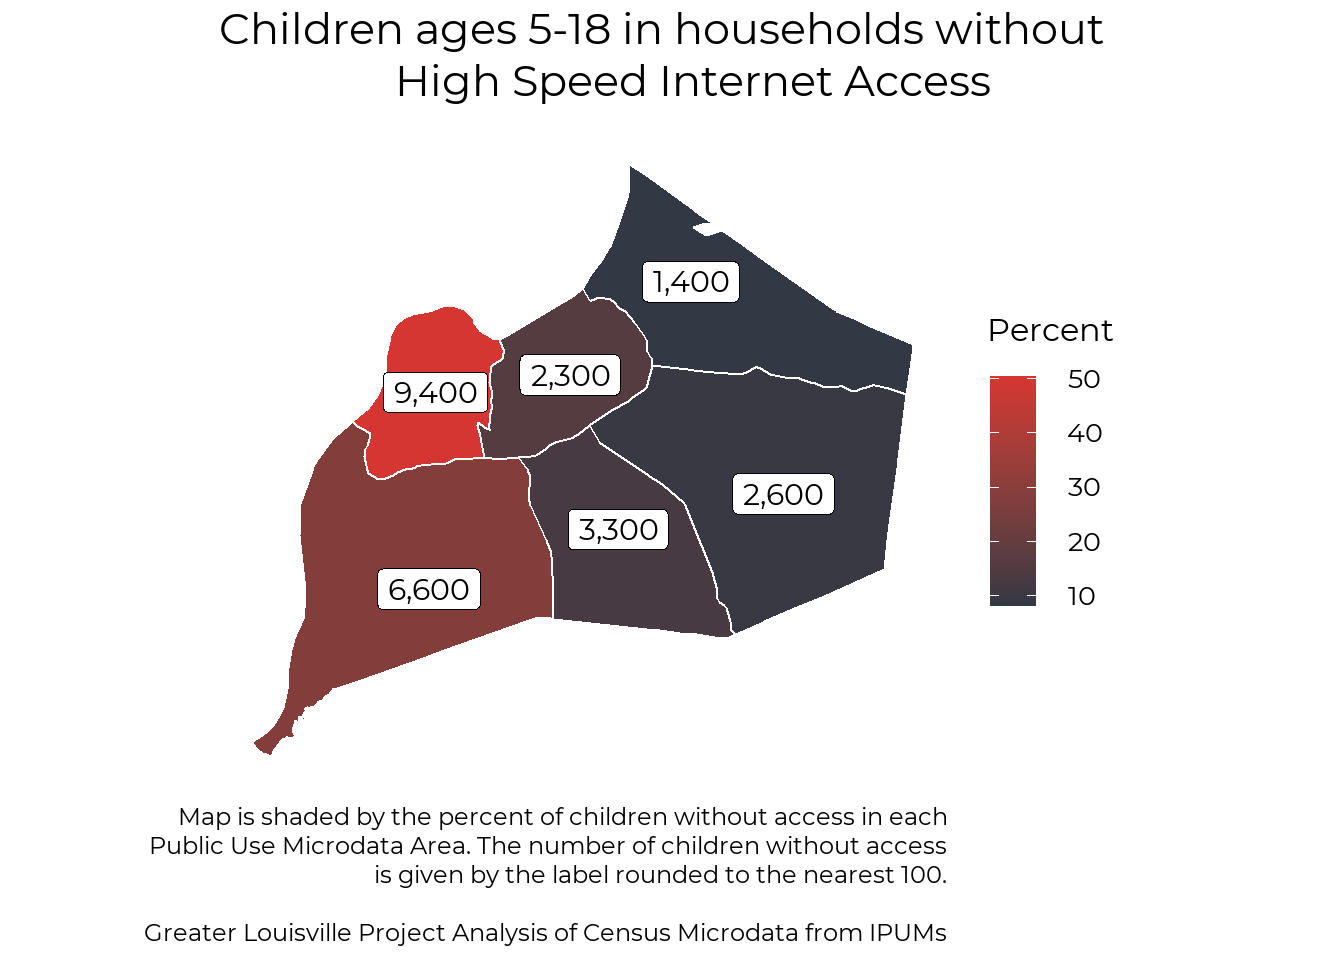
In this section, we limit the scope of our analysis to look at children ages 5-18. Non-traditional instruction (NTI) functions much better with access to high speed internet. About 25,600 school age children in Jefferson County do not have access to high speed internet. The map below is broken into 6 areas based on public use microdata geographies. Unfortunately, this is the lowest geographic level of detail we can get with Census microdata for school-age children.
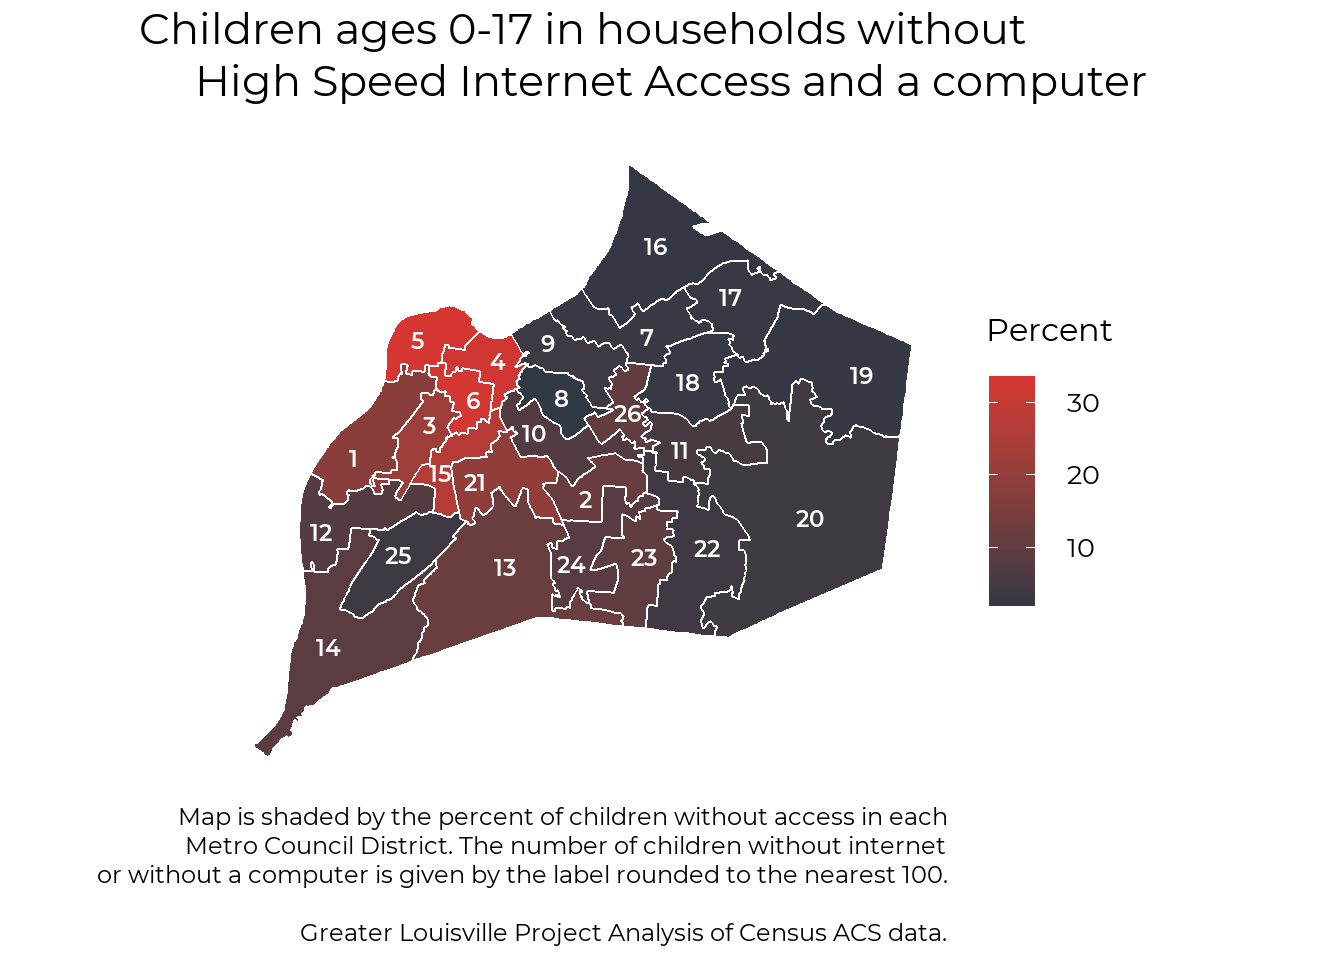
If we expand our focus to all children ages 0-17, we can get data at finer levels of geography. The map below shows the percent of children ages 0-17 who lack either high-speed internet or a device at home. Most of these children are school age, though the data also includes some babies and infants.
| District | Percent without access | Children with access | Children without access |
|---|---|---|---|
| 1 | 18.2% | 5,423 | 1,205 |
| 2 | 11.8% | 6,438 | 865 |
| 3 | 22.4% | 4,669 | 1,351 |
| 4 | 32.5% | 3,755 | 1,805 |
| 5 | 33.6% | 5,036 | 2,554 |
| 6 | 33.2% | 4,259 | 2,111 |
| 7 | 3.3% | 5,608 | 187 |
| 8 | 1.9% | 5,067 | 100 |
| 9 | 4.0% | 4,867 | 205 |
| 10 | 7.6% | 5,114 | 421 |
| 11 | 5.6% | 5,819 | 342 |
| 12 | 7.8% | 6,200 | 523 |
| 13 | 12.0% | 6,399 | 874 |
| 14 | 9.0% | 6,229 | 618 |
| 15 | 27.1% | 4,620 | 1,714 |
| 16 | 2.3% | 7,218 | 171 |
| 17 | 3.2% | 7,401 | 247 |
| 18 | 2.7% | 5,804 | 164 |
| 19 | 2.5% | 7,788 | 199 |
| 20 | 4.2% | 8,095 | 353 |
| 21 | 19.9% | 4,681 | 1,161 |
| 22 | 4.1% | 7,379 | 315 |
| 23 | 9.9% | 5,911 | 650 |
| 24 | 8.4% | 6,850 | 632 |
| 25 | 3.8% | 6,040 | 241 |
| 26 | 10.3% | 5,291 | 590 |
The lack of high speed internet access in Louisville is part of a broader trend across the United States of continuing to treat home internet as something that is ‘nice to have’ instead of something that is necessary to fully take part in modern society. In general, the U.S. leaves broadband infrastructure to private companies who will not build out infrastructure to areas that aren’t profitable. An exception to this trend in Chatanooga, TN, where the electric utility is also an Internet Service Provider. The lack of internet acess in Louisville (and throughout the U.S) has severe consequences including exacerbating inequality (both racial and economic) and slower overall economic growth.
Dr. Marty Polio of Jefferson County Public Schools, Alisia McClain of Future of Work, and Ricky Santiago of the Metro Louisville Government Office of Civic Innovation, explain the #digitaldivide in #Louisville, how it is affecting our community, current efforts underway to address it, and what more the community can do.
For each indicator, Greater Louisville Project assigns cities into one of three groups (high-performing, middle-of-the-pack, and low-performing) based on how they compare to other cities. The assignment is based on how cities naturally cluster on that indicator. Sometimes, the differences between cities are very small, and the difference between a city ranked 5th and 6th could simply be a matter of the sampling error that arises from using survey data. Thus, rather than always make a division that declares the top 5 to be the top tier, we use a natural breaks algorithm to look for a cluster of cities that is outperforming the rest, a cluster that is about average, and a cluster that is lagging. This clustering gives us a better indication of where Louisville is thriving and where Louisville has room to learn from cities that are doing better.
Z-scores (or standardization) is a way to combine data with different units of measurement into a single index. The z-score is a measure of how far away a city (or census tract, etc.) is from the average city. In order to be comparable across different units of measurement, the z-score is the distance from the mean measured in standard deviations (e.g. if Louisville has a z-score of 1 it means Louisville is 1 standard deviation above the mean of its peer cities).
Data from the Robert Wood Johnson Foundation's County Health Rankings use z-scores and all z-scores are relative to the mean of Louisville's peer cities. (On the County Health Rankings site z-scores are relative to all the counties in each state - thus z-scores reported by GLP will be different, because we are using a different reference group). The Greater Louisville Project also uses z-scores in our multidimensional poverty index, which compares each census tract to the mean of all census tracts in Louisville.