Uninsured
Access to health insurance is a significant barrier to primary care access. As such, a community’s insurance rate is a sound indicator of its health infrastructure, including the accessibility of providers and services.
Access to health insurance is a significant barrier to primary care access. As such, a community’s insurance rate is a sound indicator of its health infrastructure, including the accessibility of providers and services.
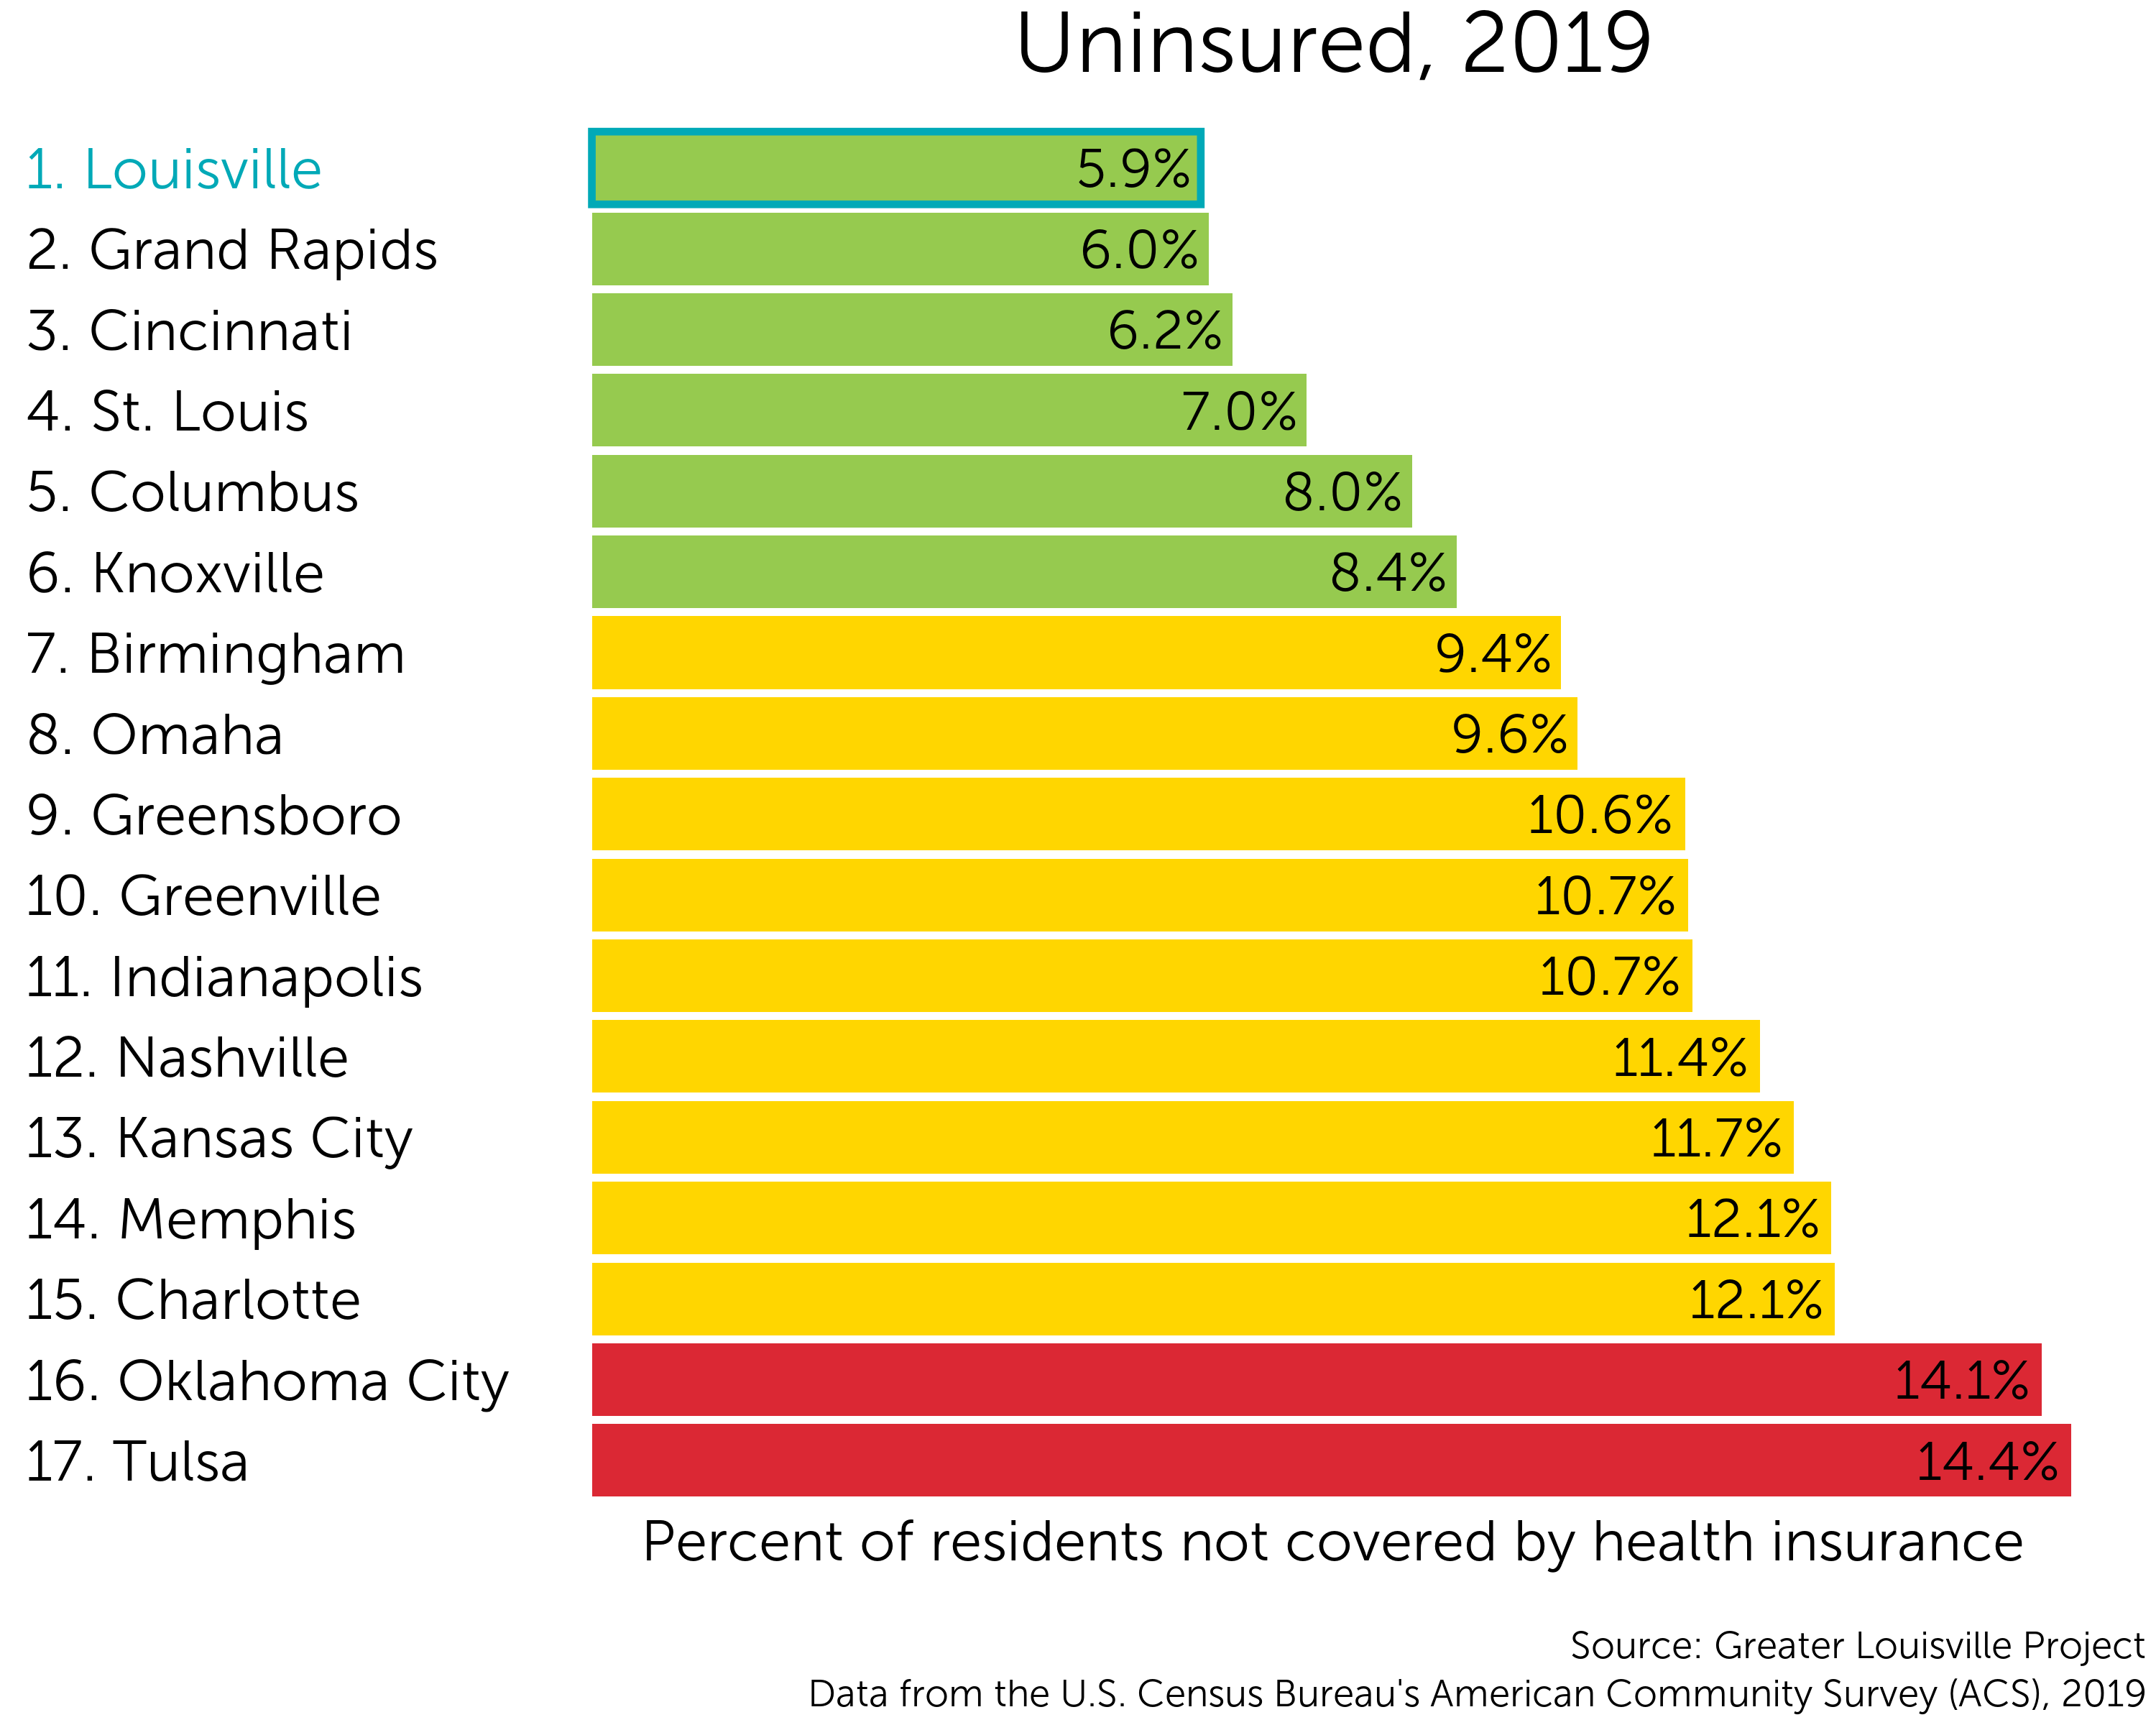
Louisville currently ranks 1st among its peer cities in the percent of the population who are insured, with only 5.9% of Louisville residents being uninsured.
On this metric, Louisville ranks among the top tier of its peer group according to a natural breaks algorithm. Cities in green are those that outperform their peers. Cities in yellow represent the middle cluster, and those in red lag behind their peers on this indicator.
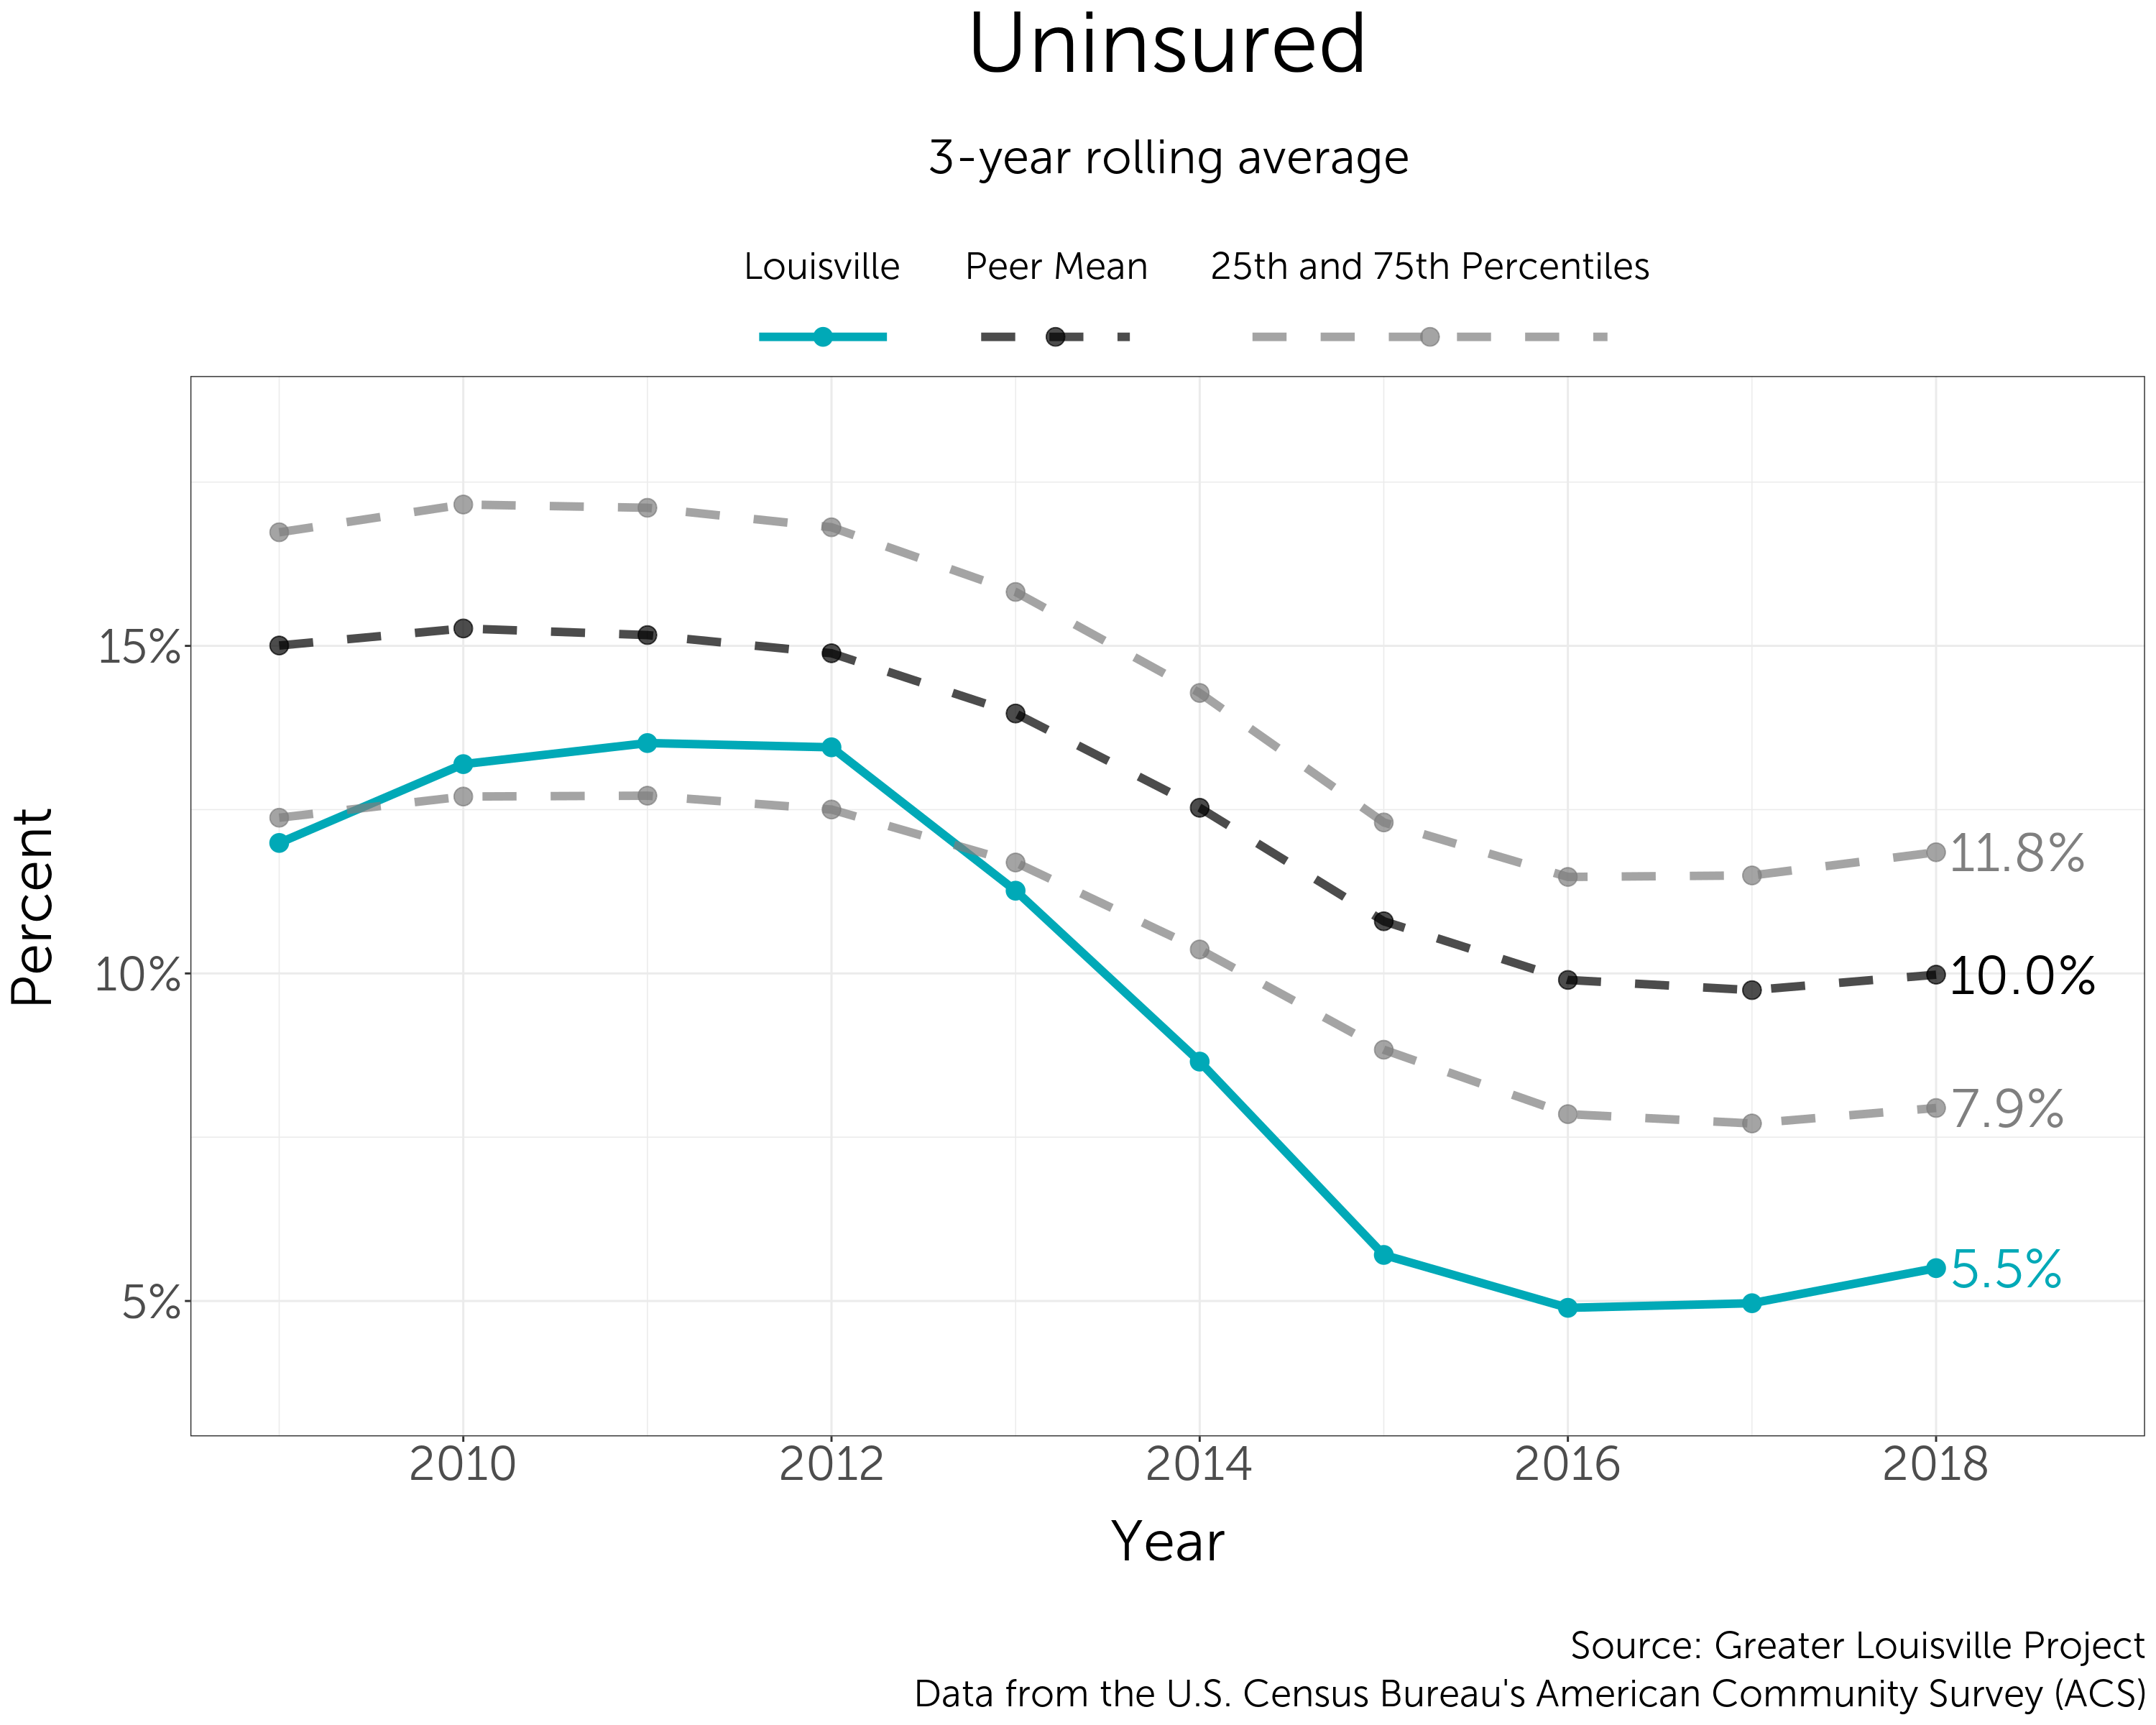
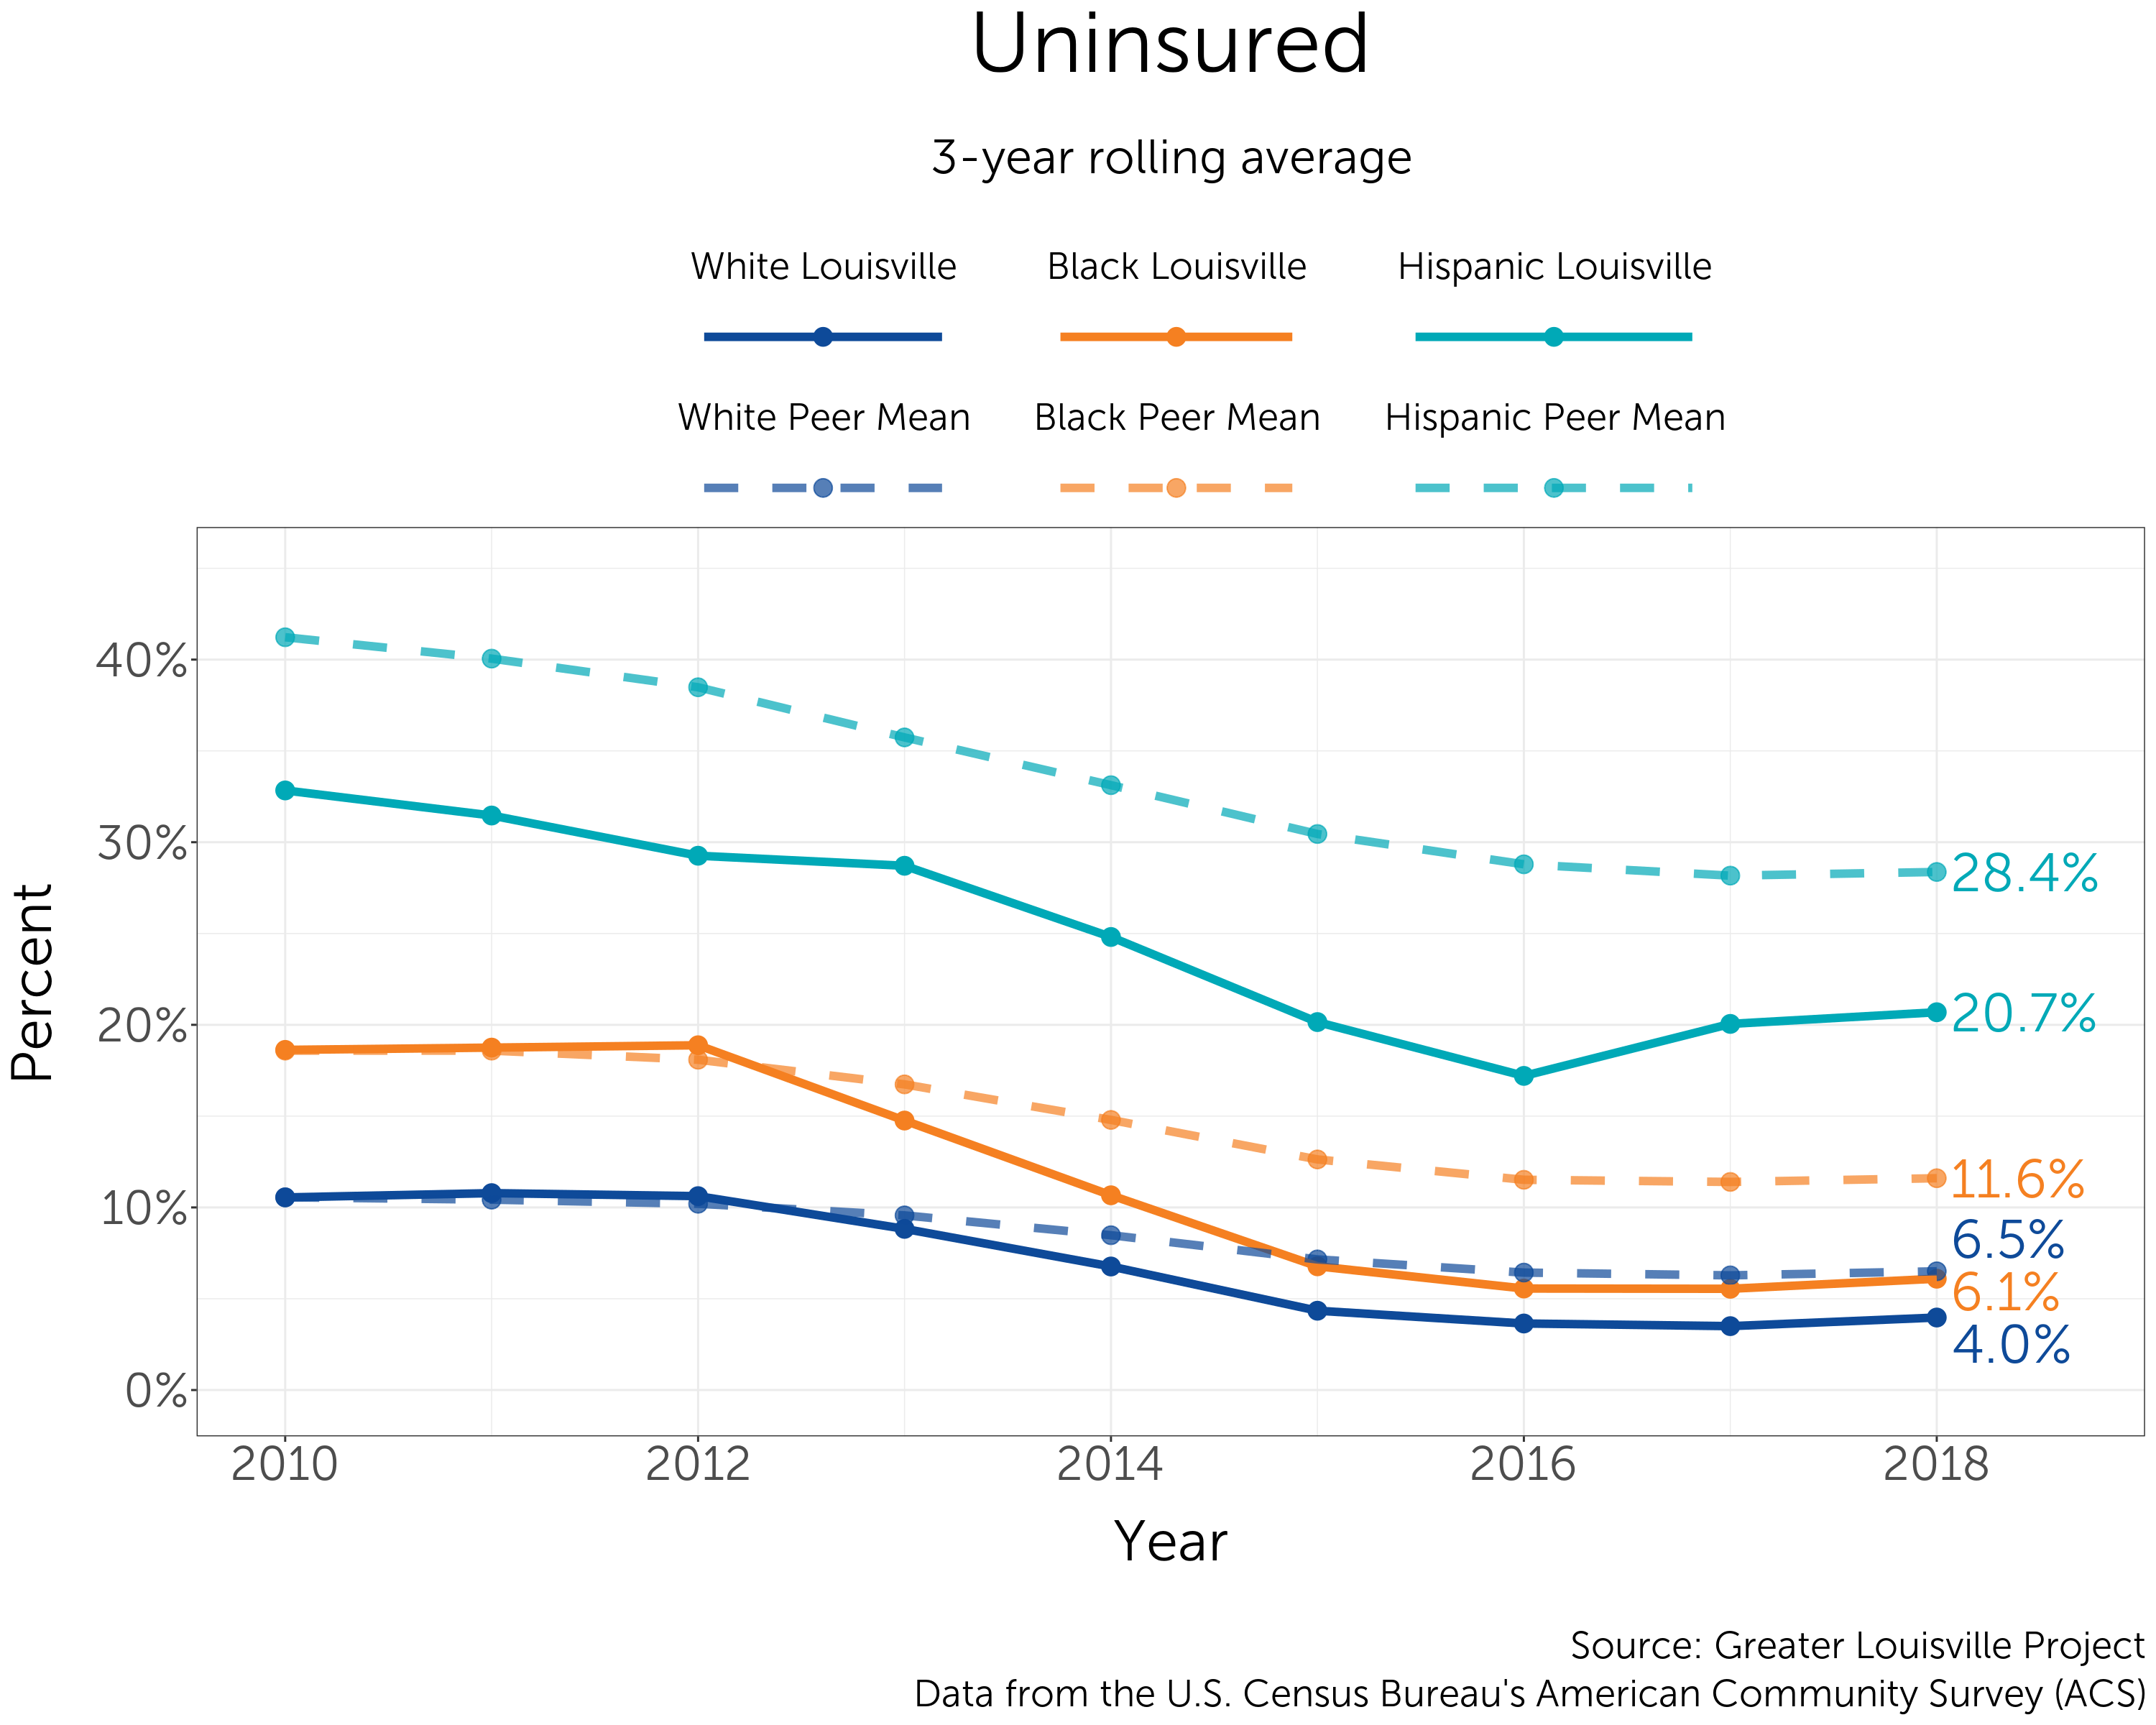
The percent of uninsured individuals decreased substantially during the middle of the last decade but appears to have since leveled off and may now be rising. In the early 2010s, Louisville saw a significant reduction in its uninsured rate and continues to outperform its peers.
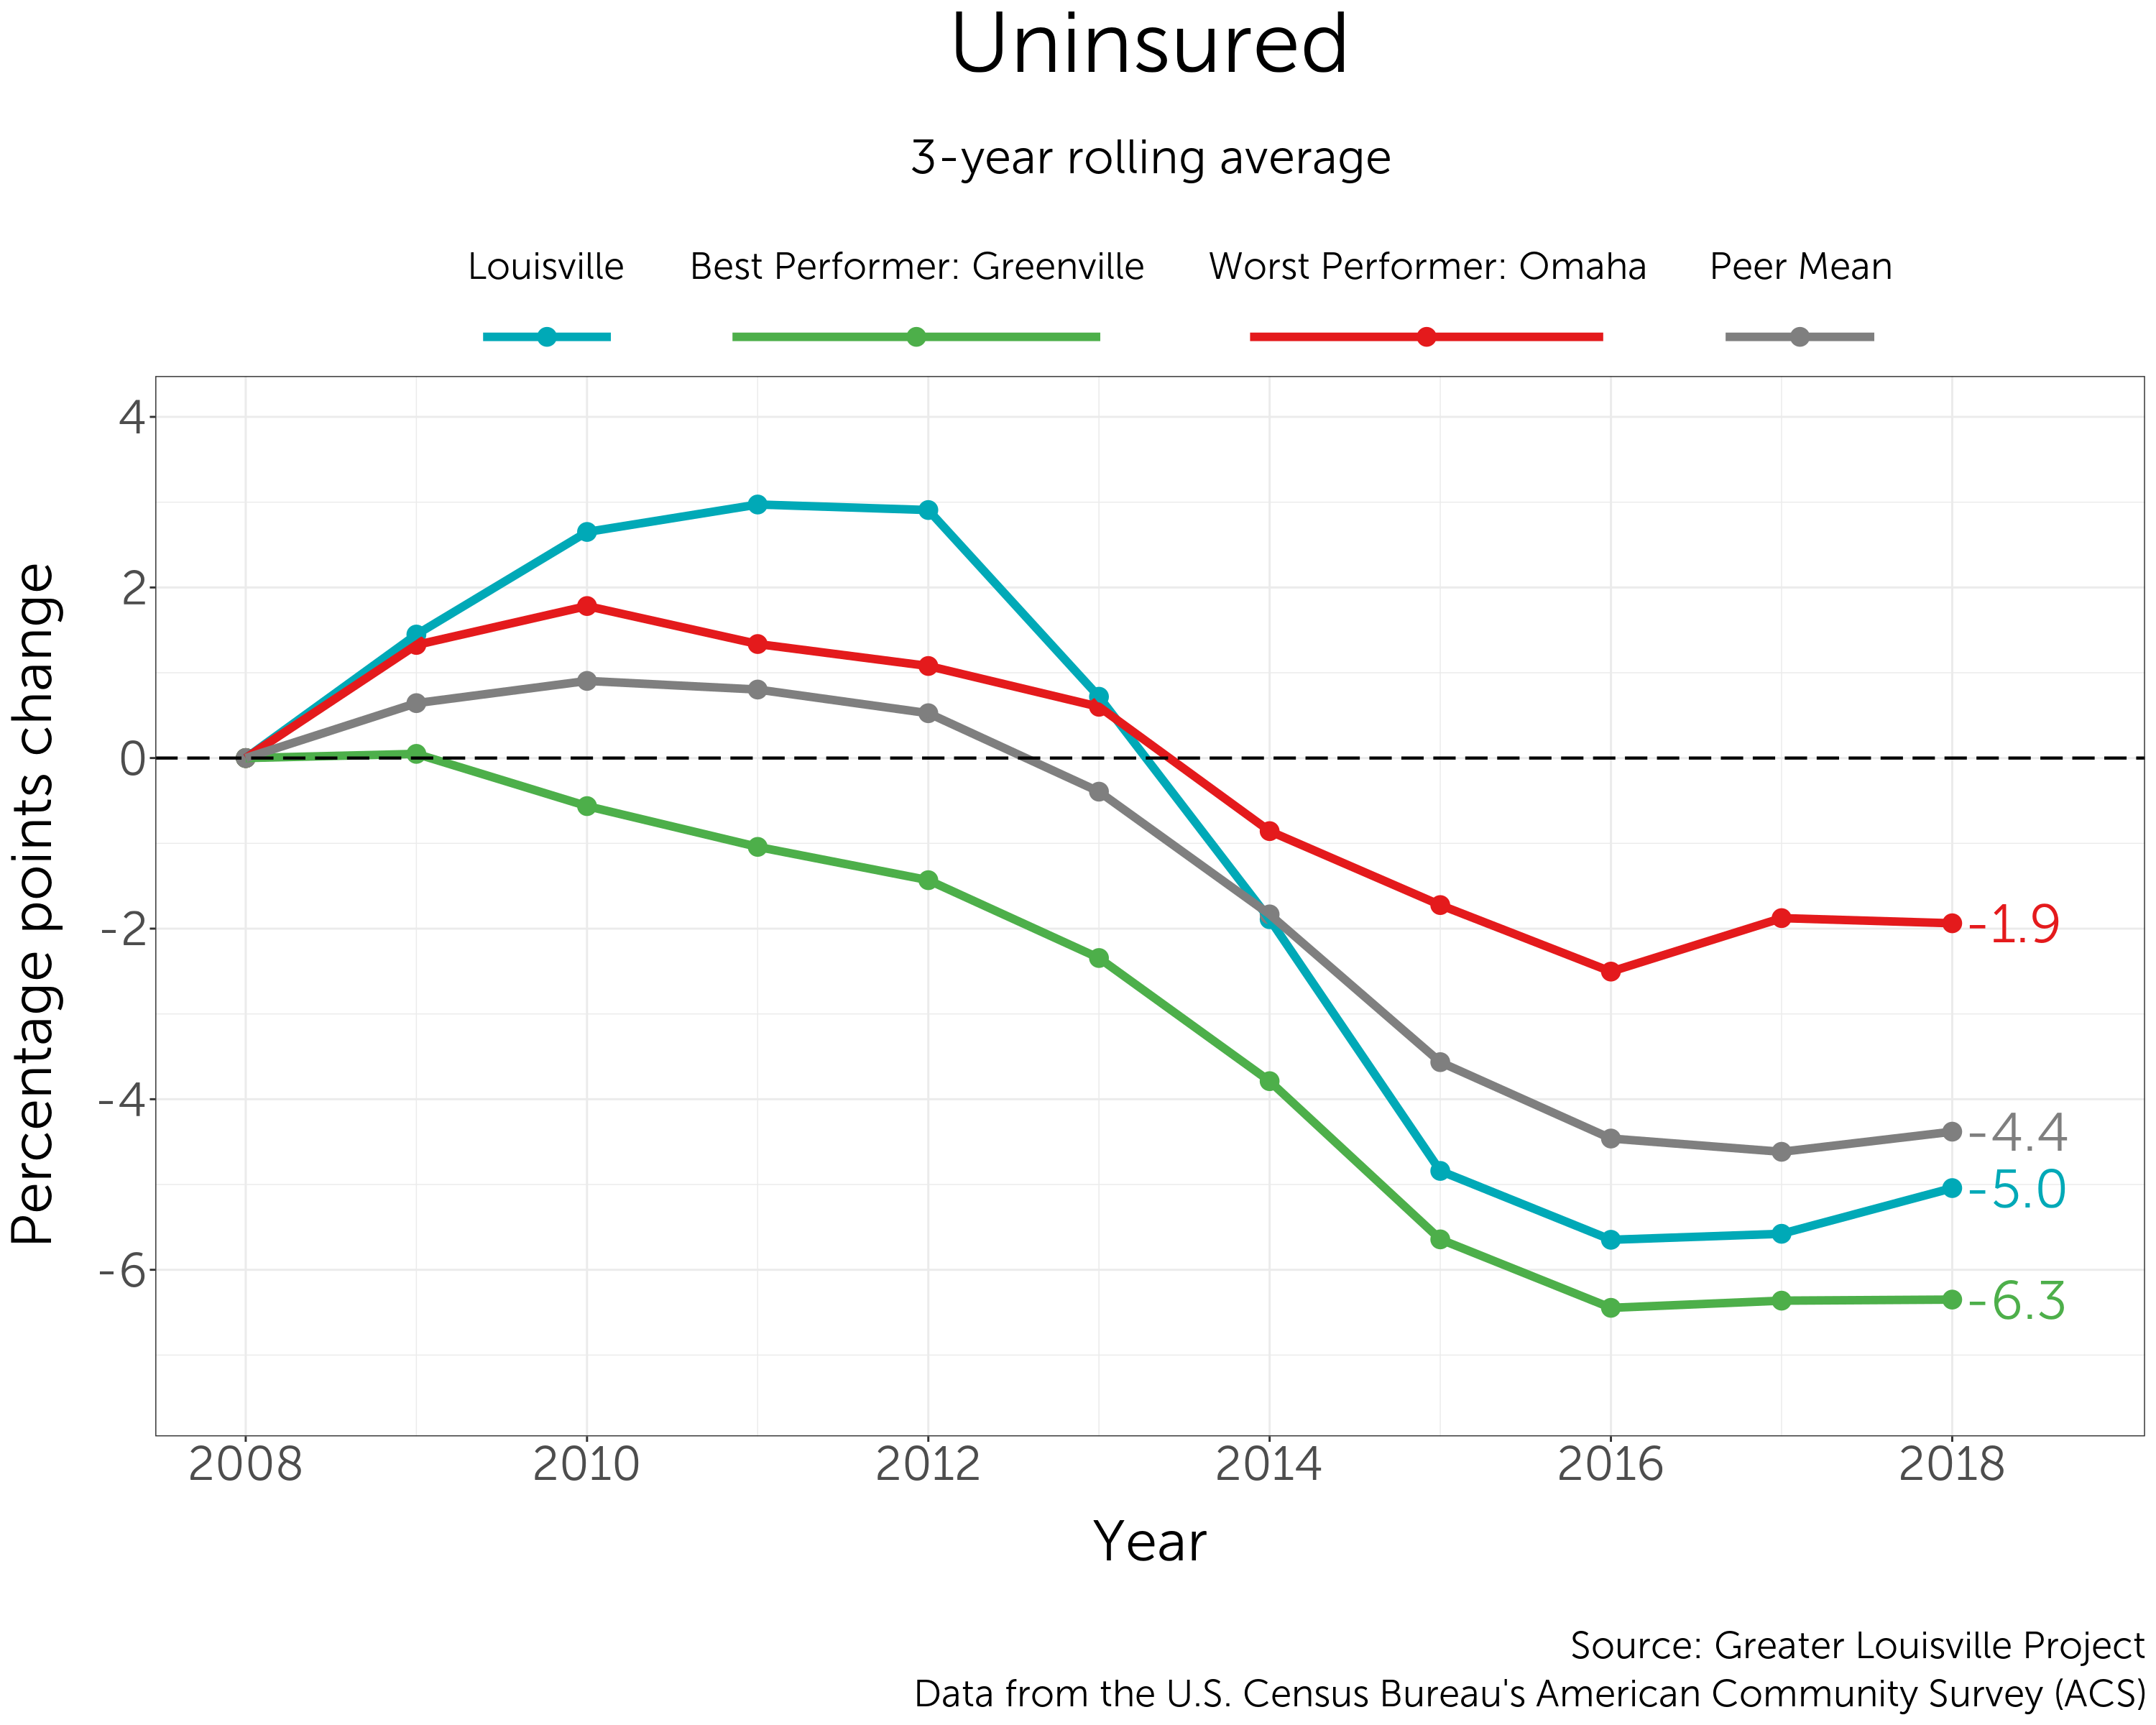
Louisville currently has the lowest percentage of residents who are living without health insurance, but, over the last decade, Greenville has seen its uninsurance rate decrease the most — by about 6 percentage points. Over the same time period, Omaha has decreased its share of uninsured residents by only about 2 percentage points.
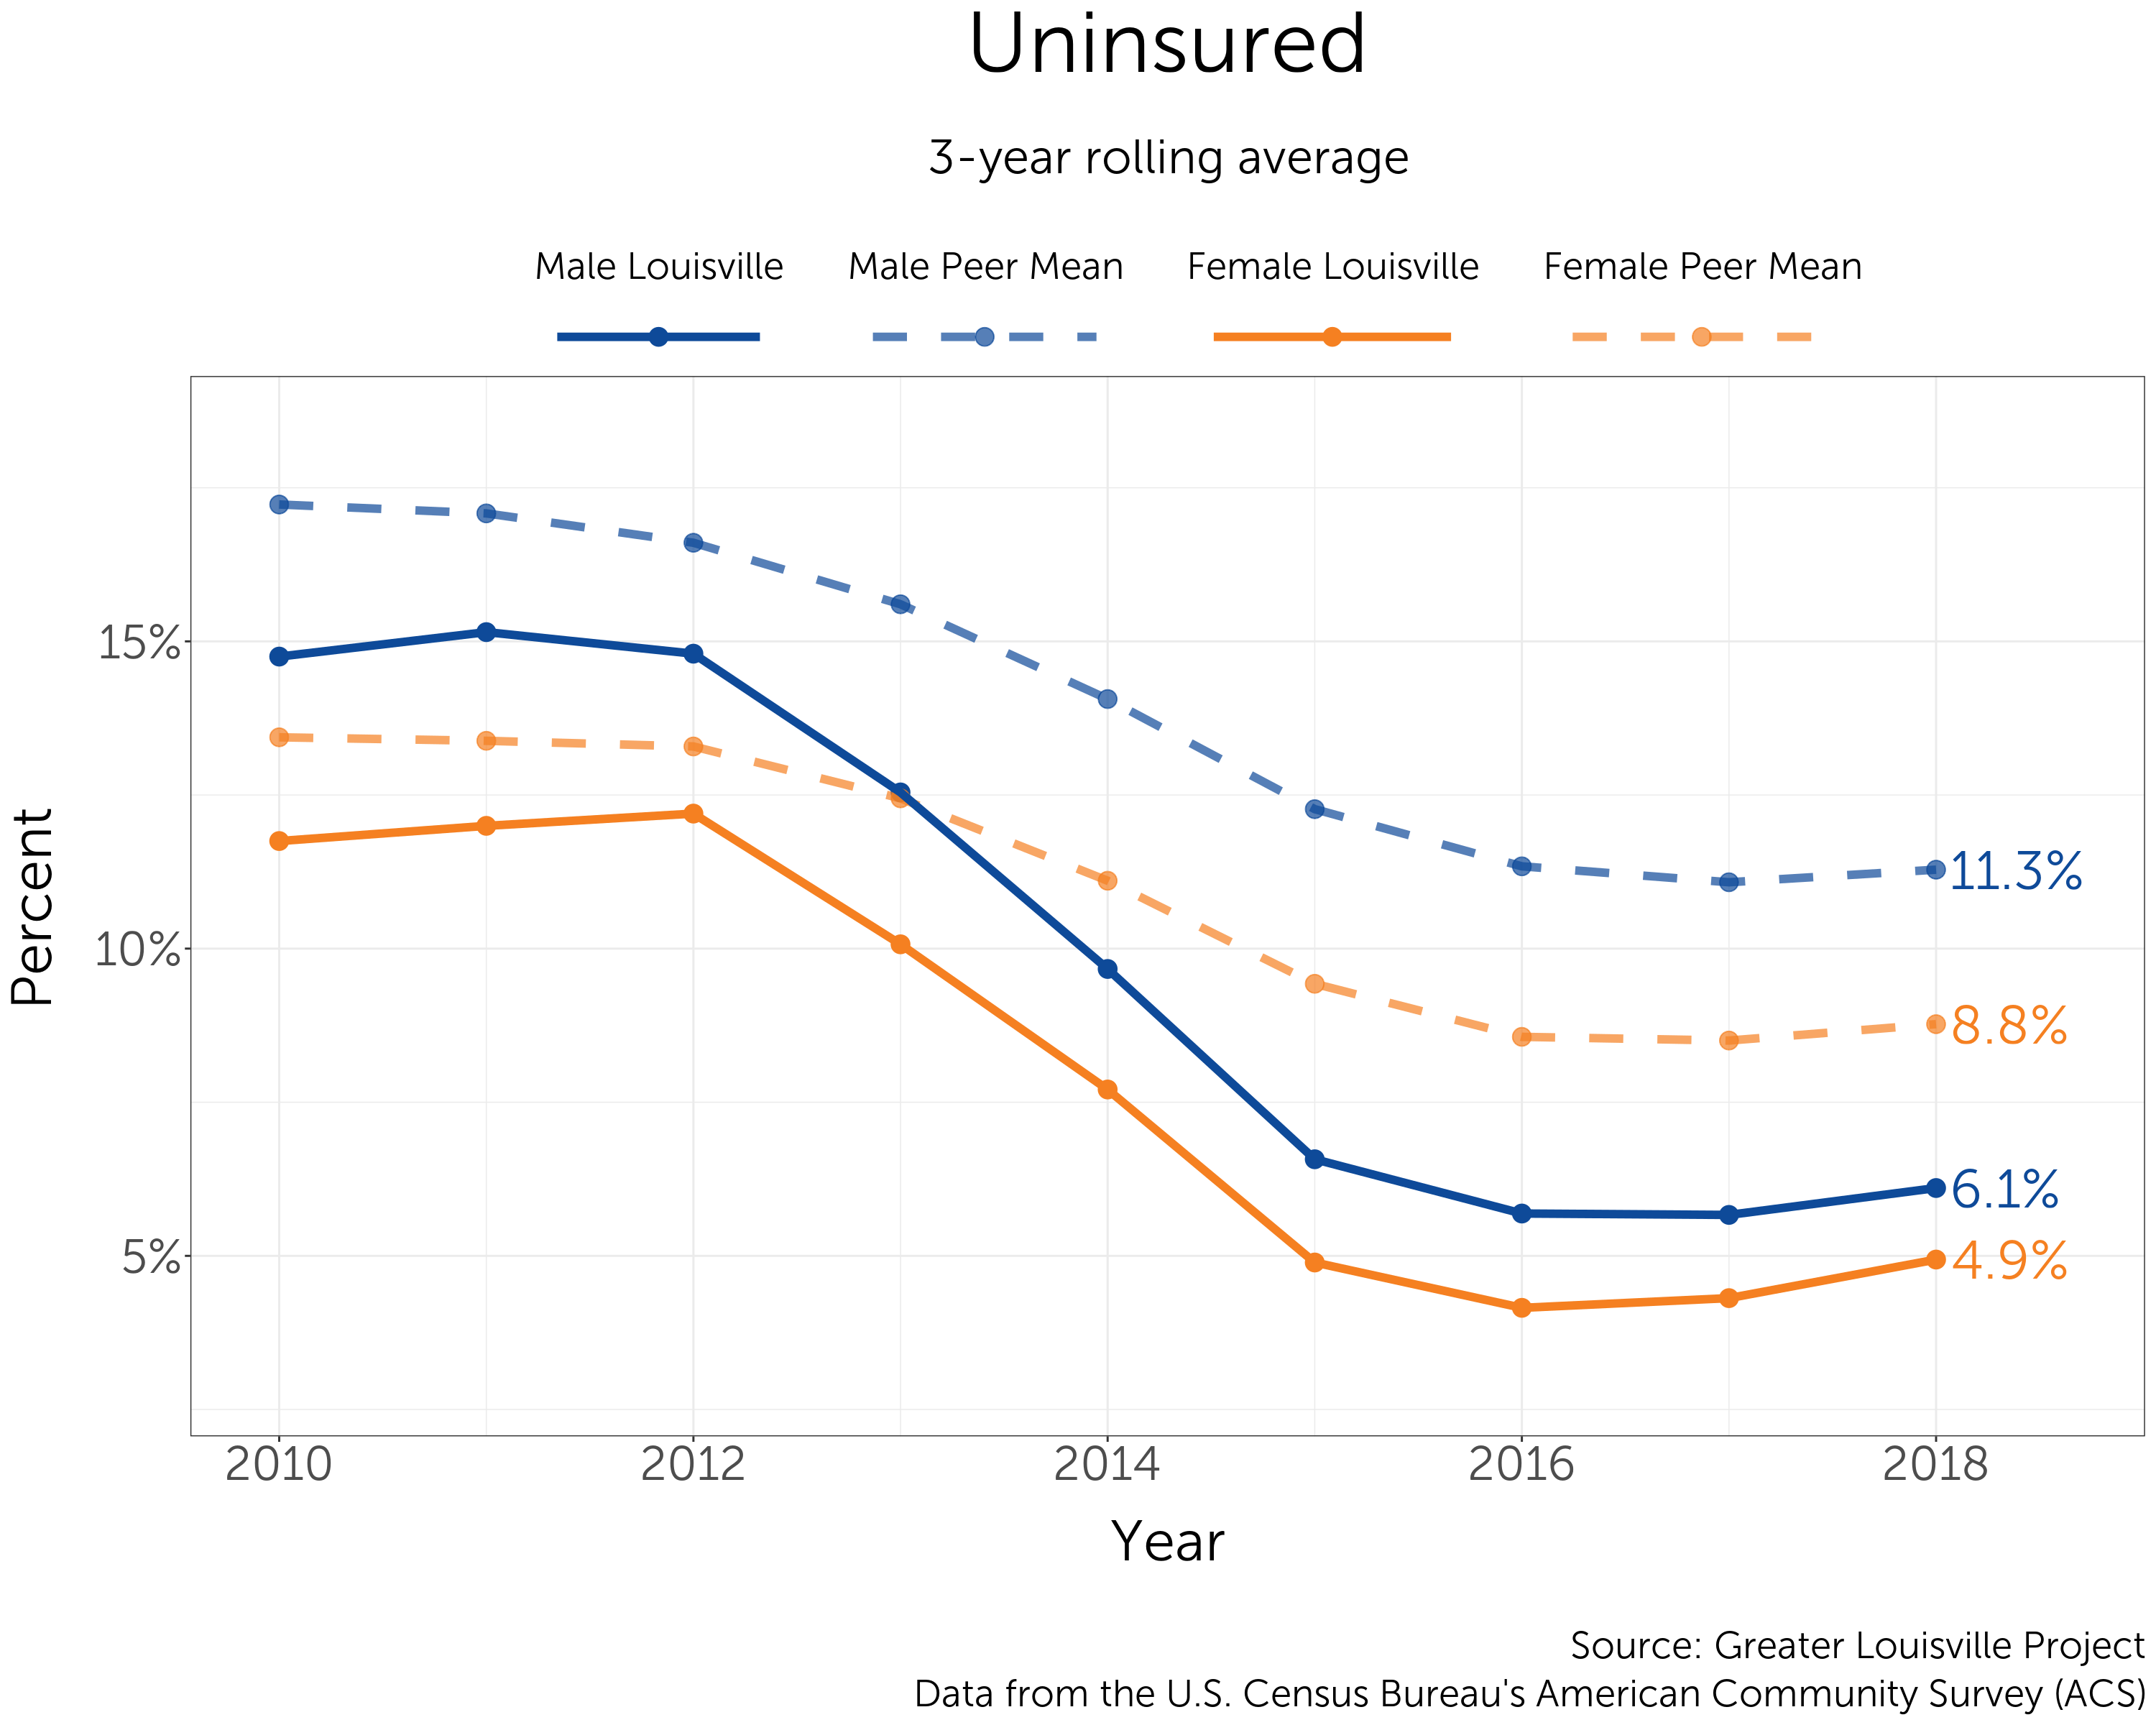
Overall, in Louisville and its peer cities, a higher share of men are uninsured than women. However, in recent years, the uninsured gap between men and women has consistently narrowed.
The percent of Hispanic residents who are uninsured in Louisville and its peer cities sits well above the percent of Black and White residents who are uninsured. Meanwhile, in Louisville, the gap between Black and White residents who are uninsured has narrowed in recent years, now sitting just about 2 percentage points away from each other.

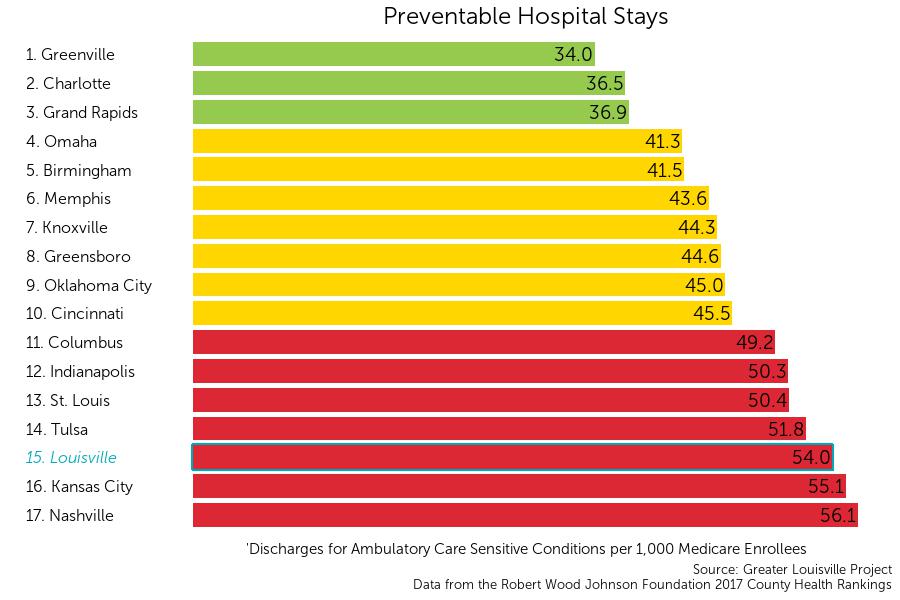
Preventable hospital stays are a proxy for understanding the role and impact of the available community healthcare network. Ambulatory care sensitive conditions include conditions such as convulsions, COPD, pneumonia, asthma, and diabetes. This measure is used to assess how often people use hospitals for such conditions instead of primary care providers, indicating the accessibility of care for individuals. This measure uses Medicare data, focusing on individuals aged 65 and older, which means that it will not be reflective of hospital stays for younger generations.
Louisville currently ranks 15th among its peer cities in age-adjusted discharges for ambulatory care sensitive conditions per 1,000 medicare enrollees with 54 per 1,000.
On this metric, Louisville ranks among the bottom tier of its peer group according to a natural breaks algorithm. Cities in green are those that outperform their peers, cities in yellow represent the middle cluster, and those in red are a group that lags behind its peers on this indicator.
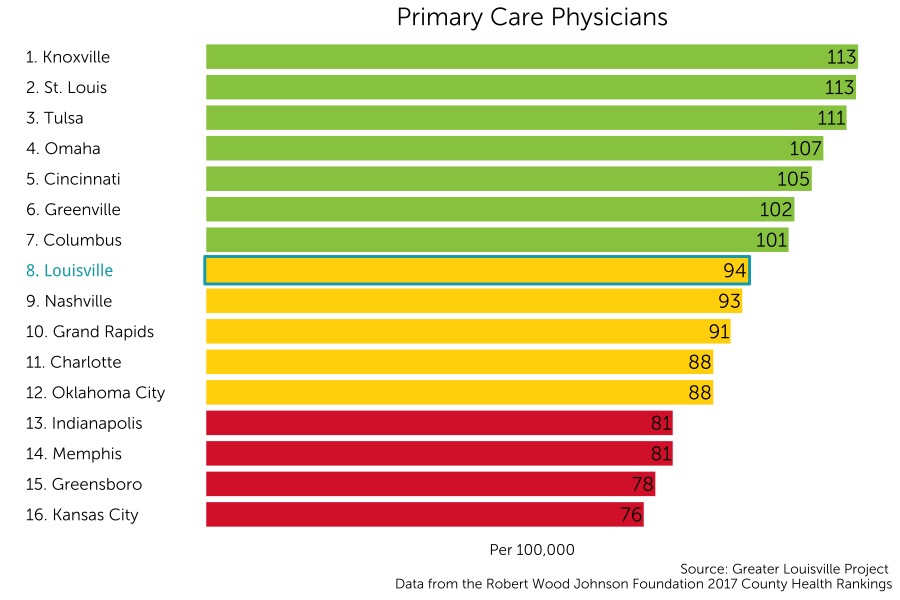
Access to primary care providers is important for maintaining the health of a community. Primary care access is an excellent indicator of the status of a community’s overall health infrastructure, ensuring medical needs and services are provided to a community in a reasonable and accessible fashion.
Louisville currently ranks 9th among its peer cities in number of primary care providers with 94 providers per 100,000 people.
Louisville is in the middle tier of its peer group according to a natural breaks algorithm. Cities in green are those that outperform their peers, cities in yellow represent the middle cluster, and those in red are a group that lags behind its peers on this indicator.
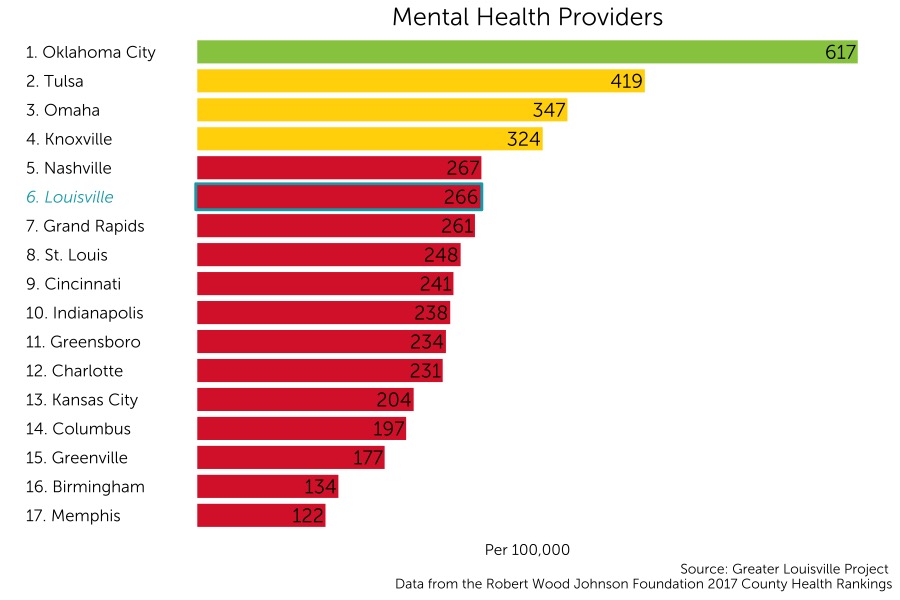
Mental health has historically been a neglected health focus in preventive health and overall health maintenance. Mental health care availability is gaining support in the U.S. and helps improve quality of life and health outcomes.
Louisville currently ranks 6th among its peer cities in number of mental health care providers per 100,000 with 266 providers per 100,000 people.
Despite the high ranking, Louisville still ranks among the bottom tier of its peer group according to a natural breaks algorithm. Cities in green are those that outperform their peers, cities in yellow represent the middle cluster, and those in red are a group that lags behind its peers on this indicator.
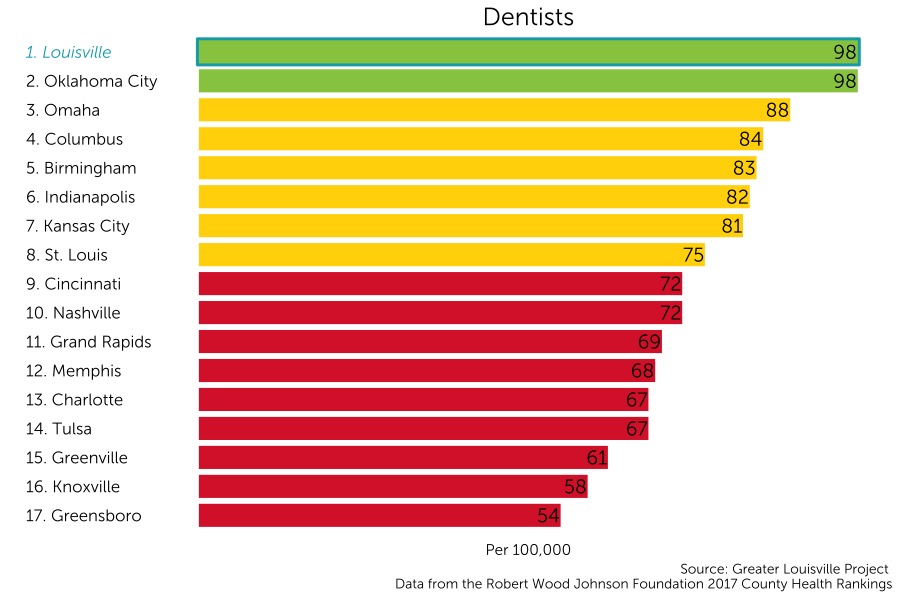
Dental care is incredibly important for the health of an individual. Regular dental care can result in lower direct and indirect medical costs. Dental care is also positively correlated with mental health, making dental care an incredibly important yet often overlooked need in a community.
Louisville currently ranks 1st among its peer cities in number of dentists per 100,000 people in Louisville with 98 per 100,000.
On this metric, Louisville ranks among the top tier of its peer group according to a natural breaks algorithm. Cities in green are those that outperform their peers, cities in yellow represent the middle cluster, and those in red are a group that lags behind its peers on this indicator.
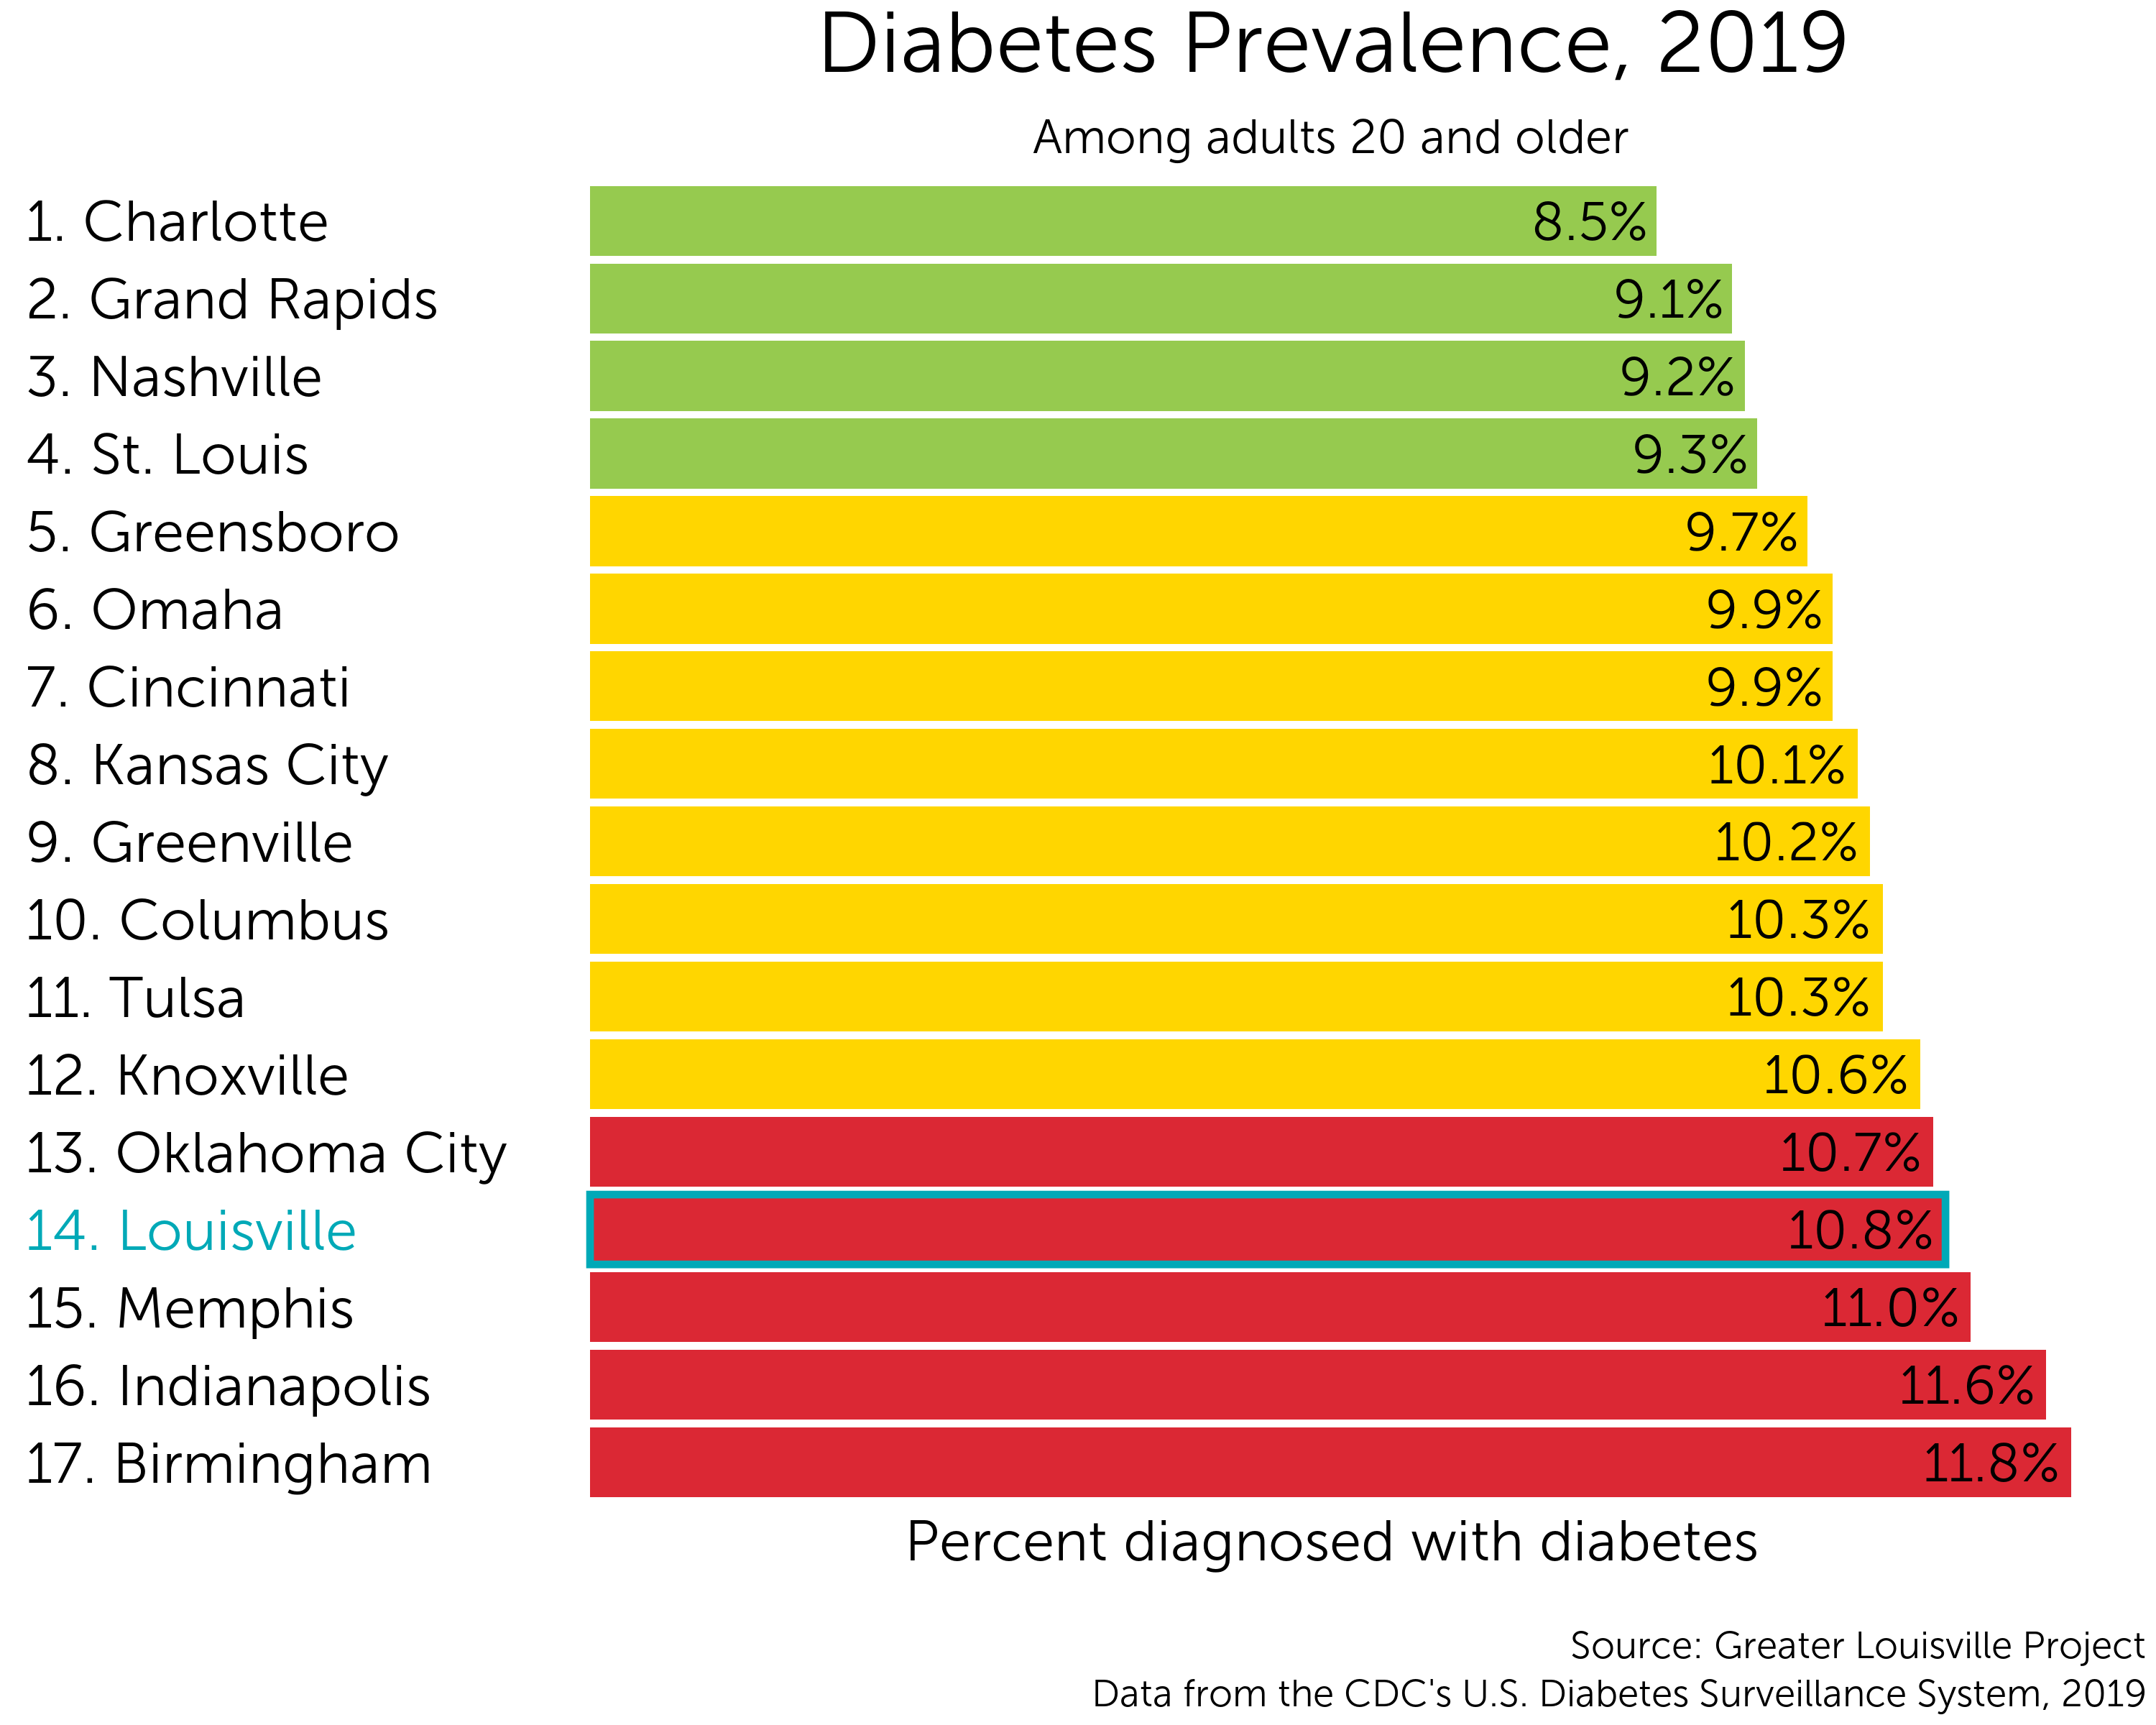
Diabetes diagnoses in the U.S. continue to rise, bringing with them additional complications that are sometimes disabling or even life-threatening. Those complications can include cardiovascular disease, nerve damage, kidney damage, eye damage and other conditions.
Louisville currently ranks 14th among its peer cities in the percent of adults who are 20 and older who have been diagnosed with diabetes.
Louisville is in the bottom tier of its peer group according to a natural breaks algorithm. Cities in green are those that outperform their peers. Cities in yellow represent the middle cluster, and those in red lag behind their peers on this indicator.
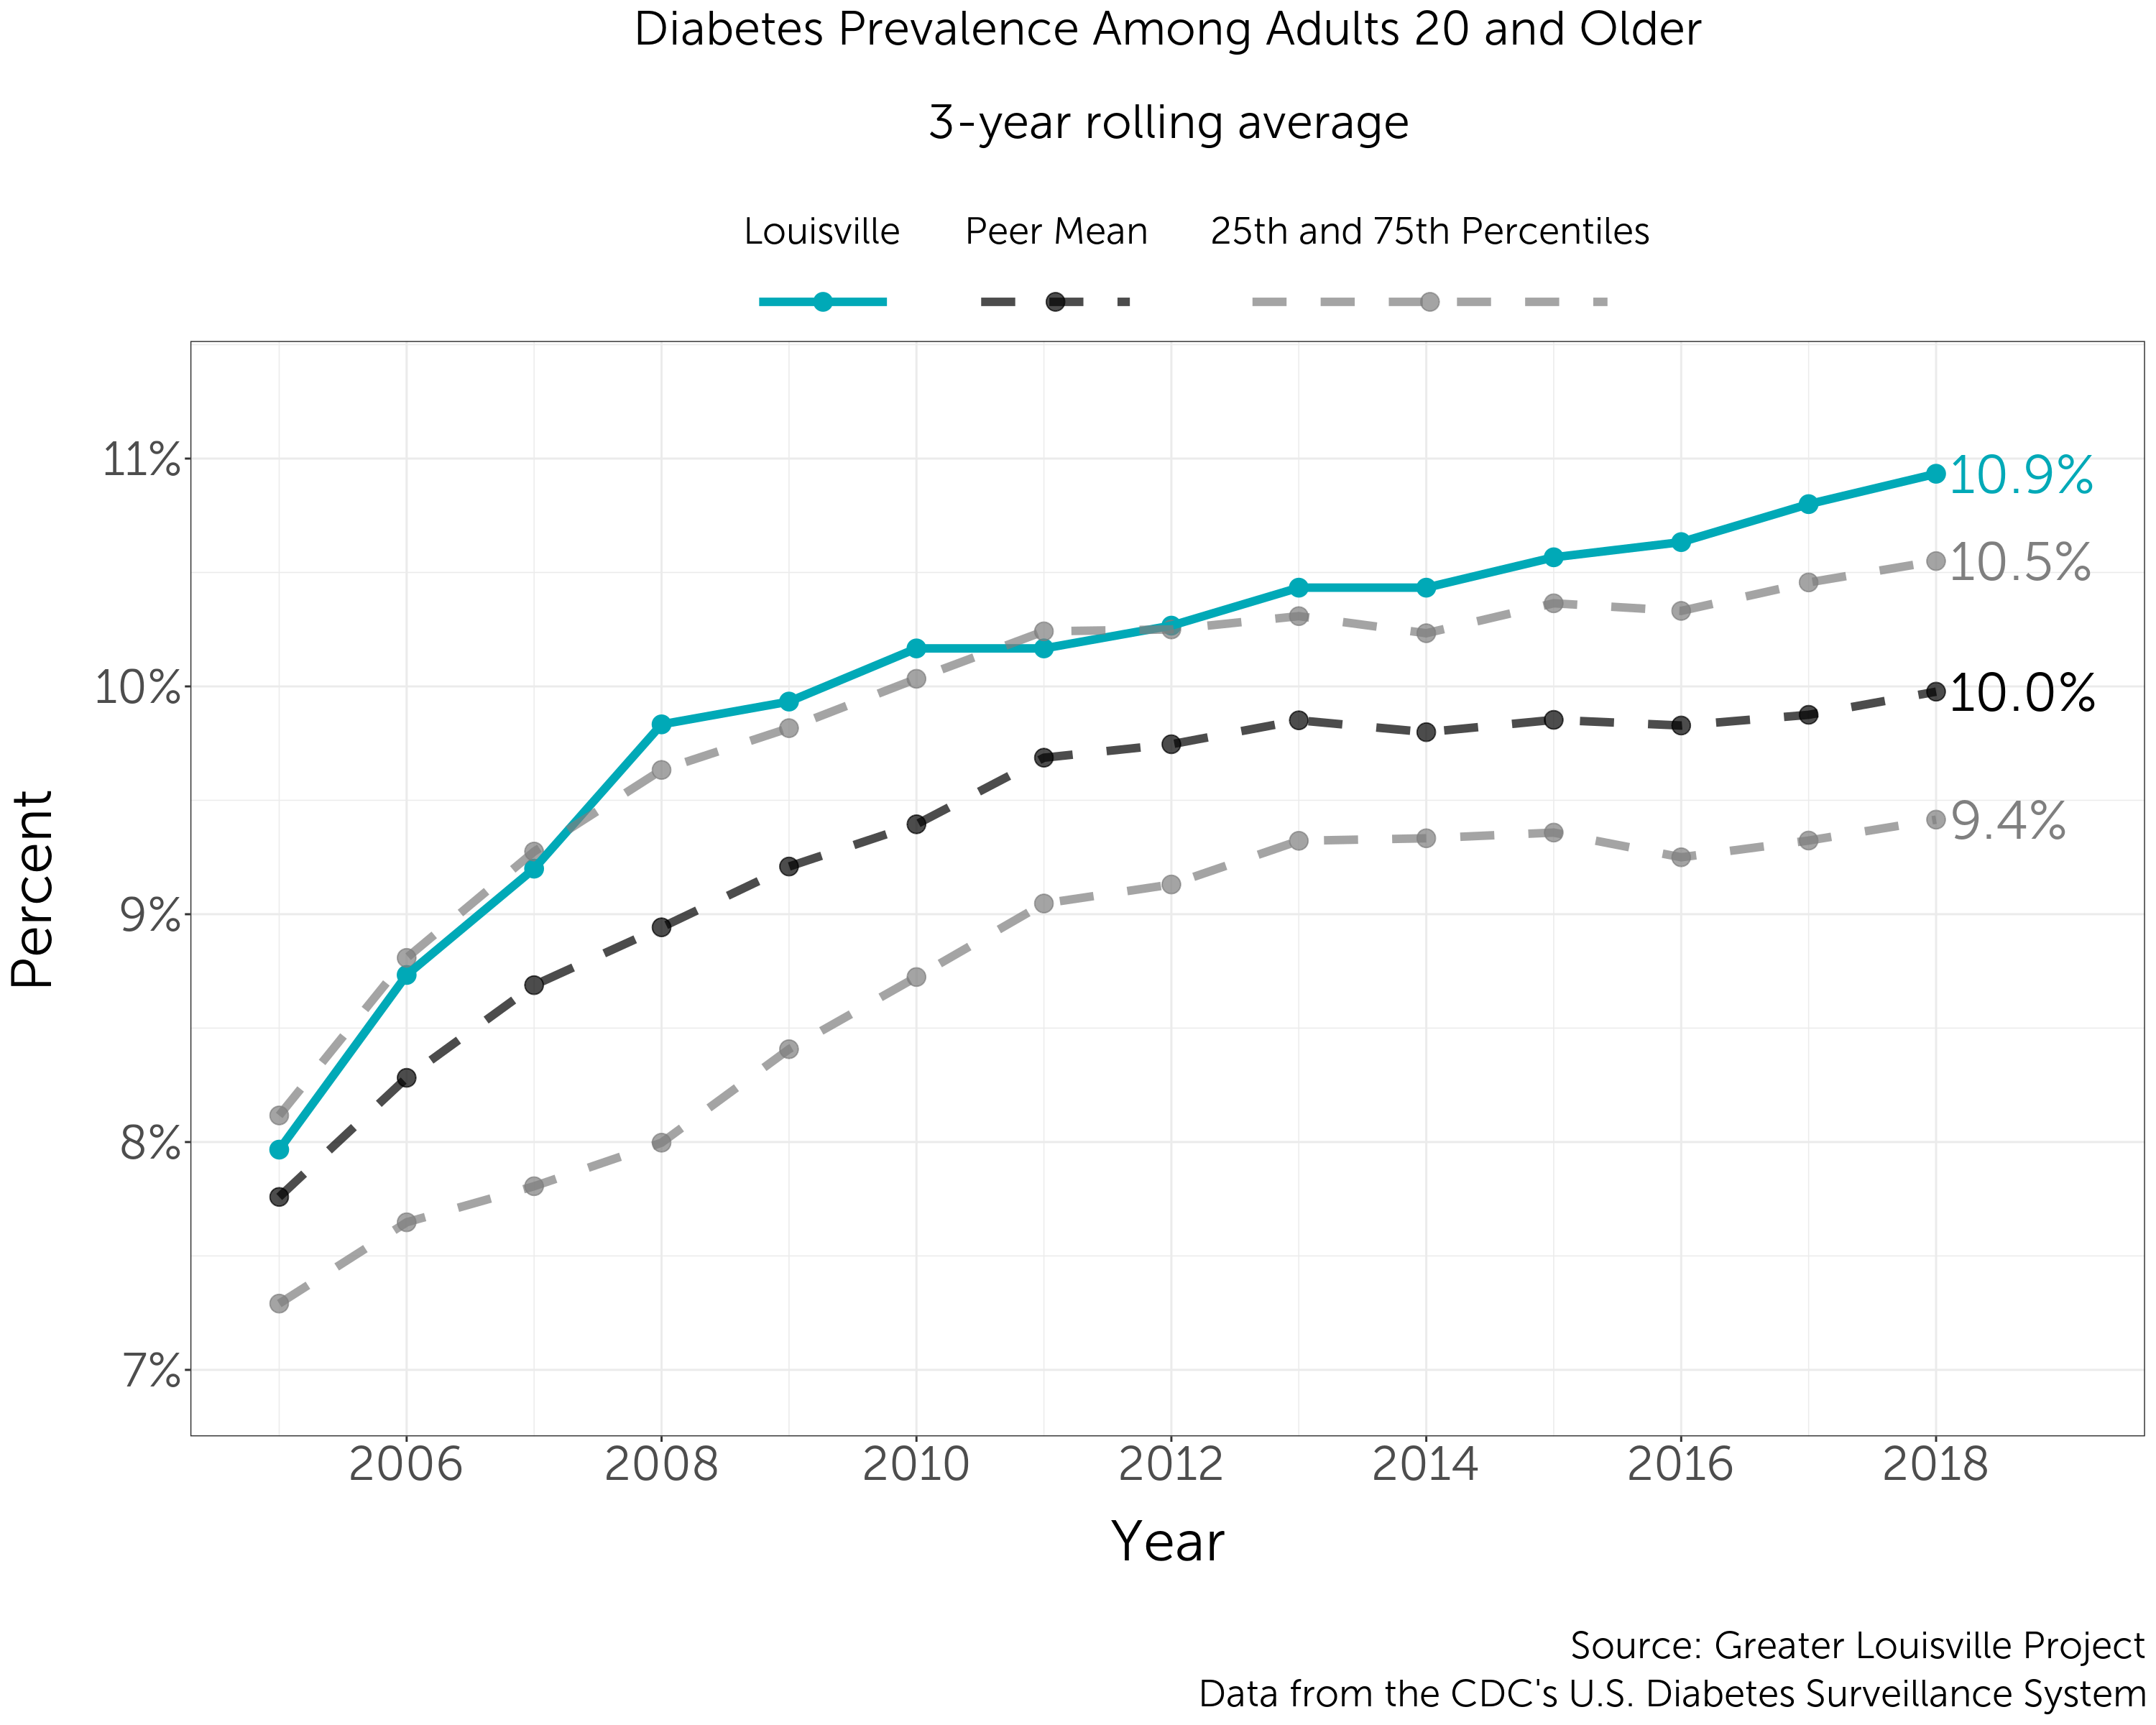
Since 2004, the percent of the adult population diagnosed with diabetes has increased, though it is now increasing at a slower rate than it was two decades ago. Louisville generally followed the trend of its peer cities until the early 2010s, at which point it started to diverge and recorded higher shares of diabetes diagnoses.
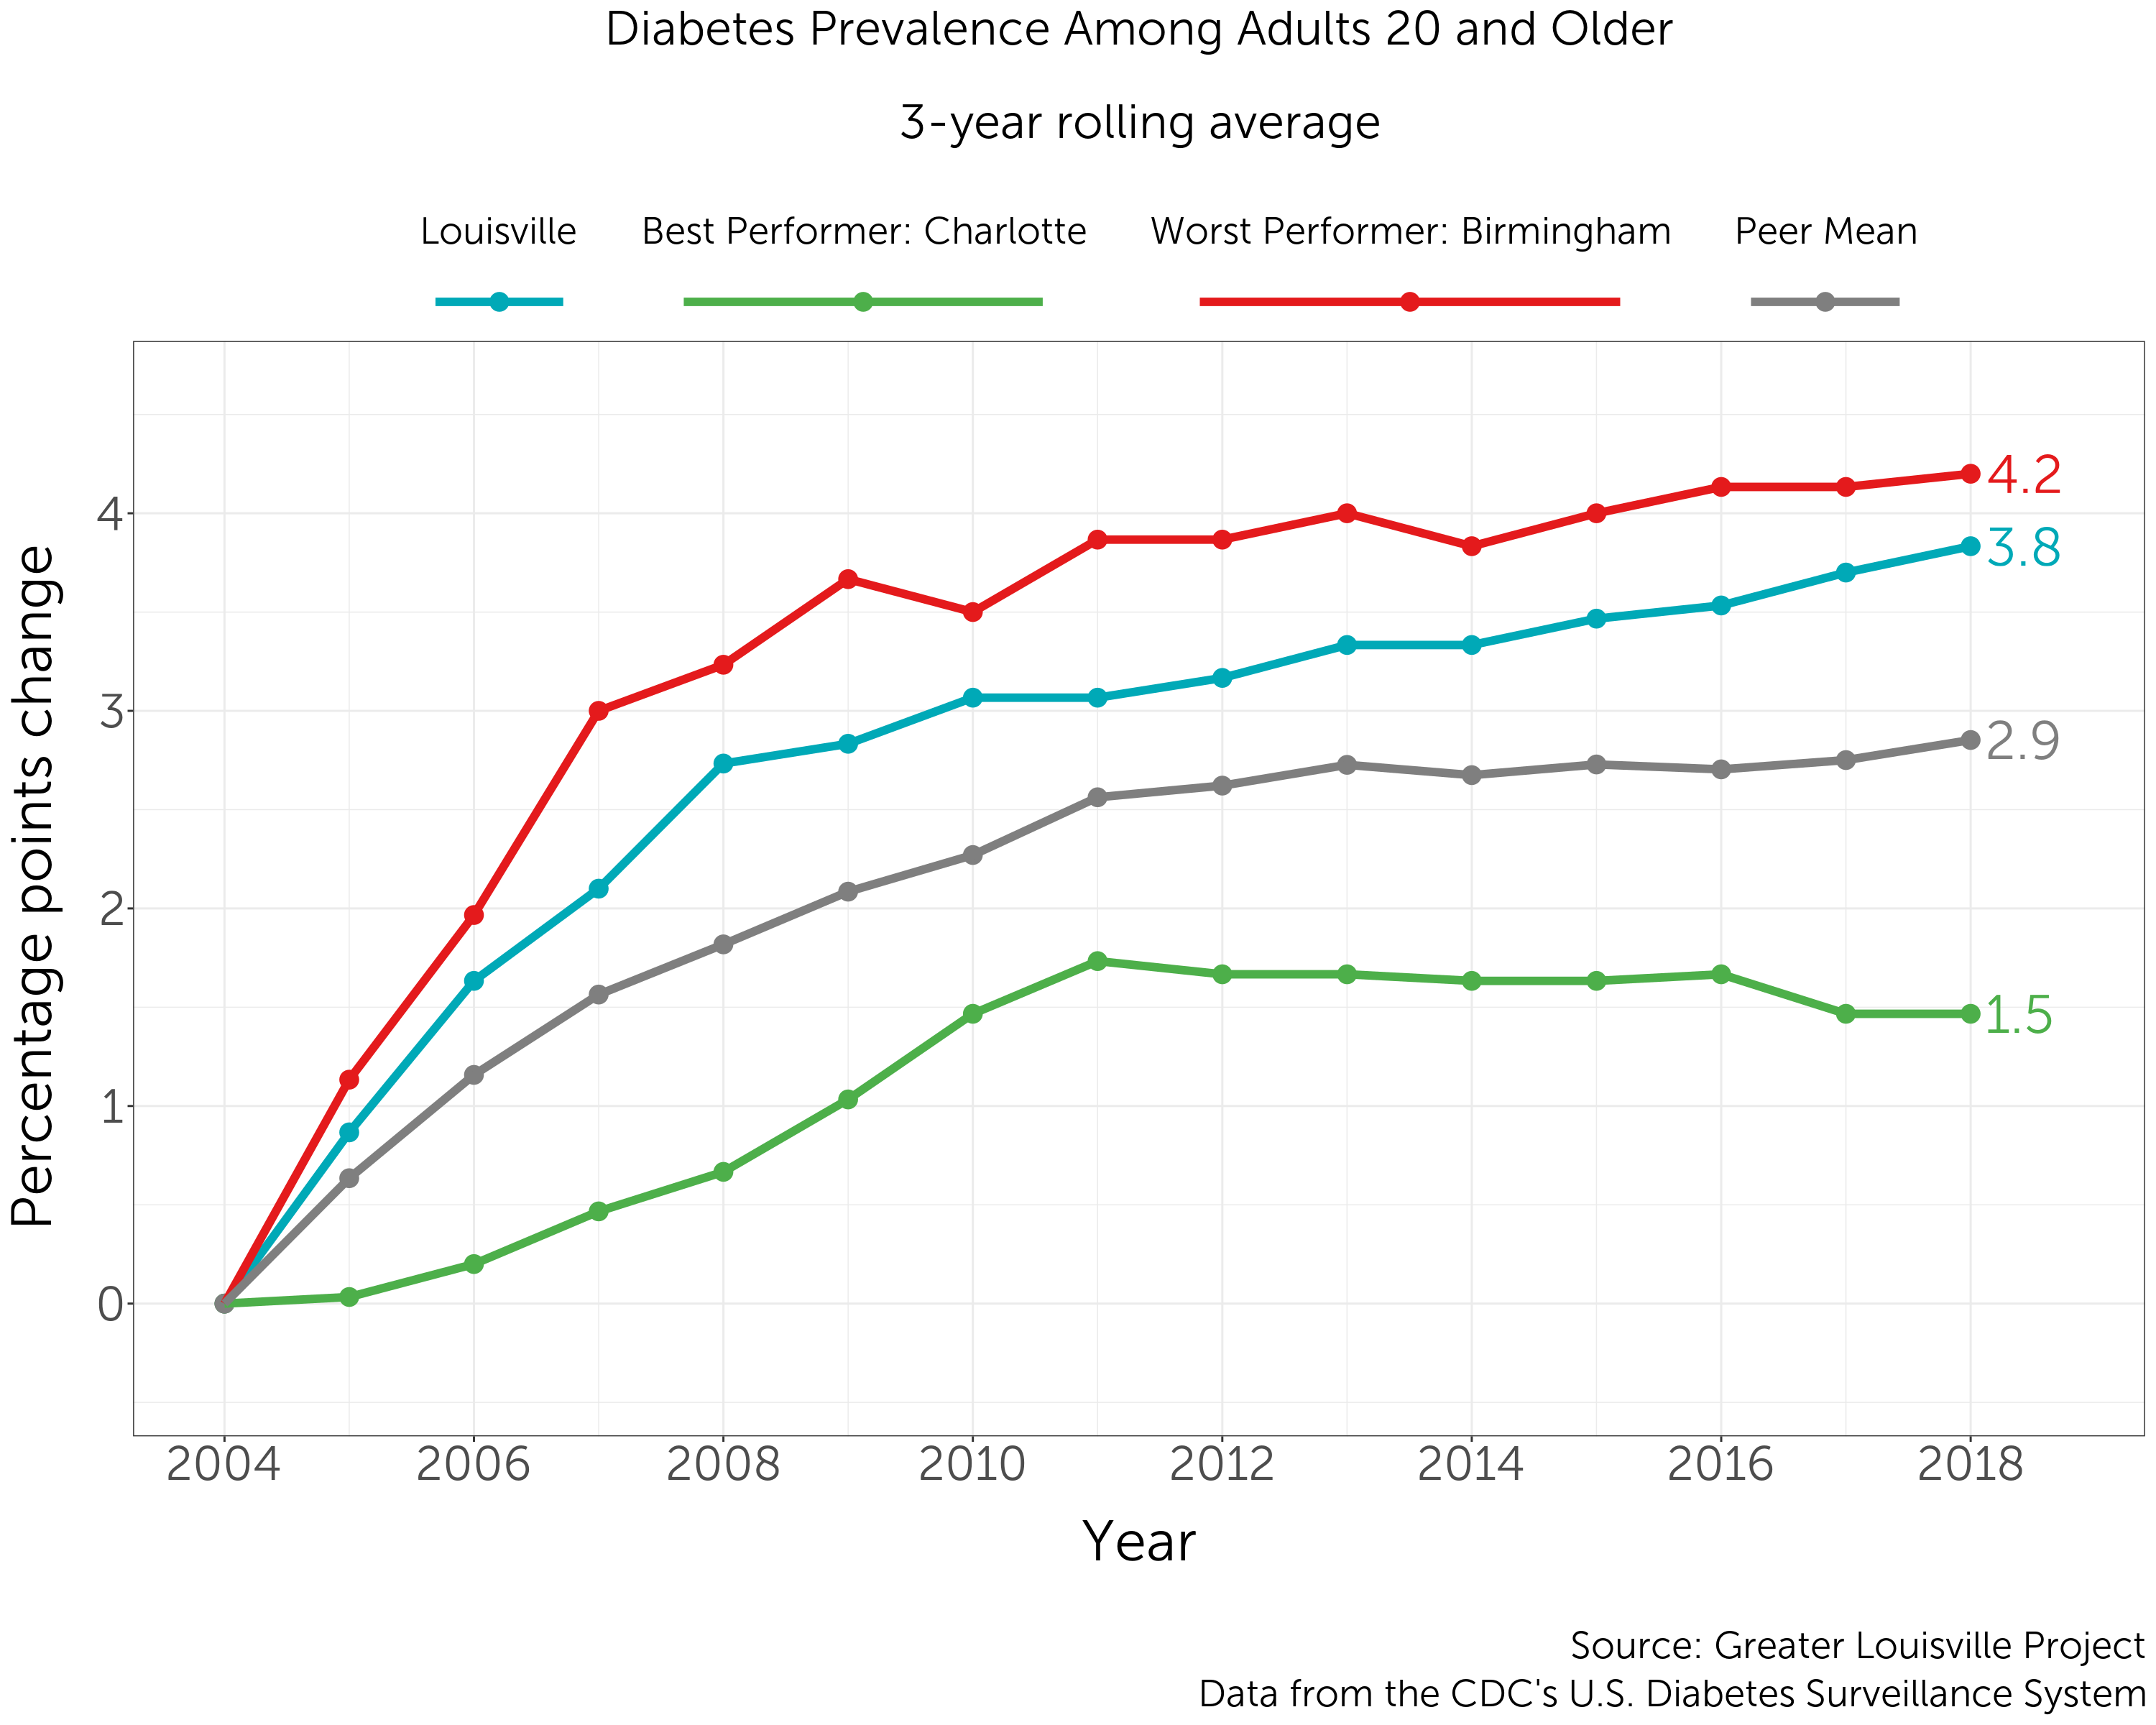
Louisville and all of its peer cities have recorded higher rates of diabetes since 2004. Overall, the diabetes rate has risen the most in Birmingham, at about 4 percentage points. Meanwhile, in Charlotte, the best performer, the diabetes rate rose by 1.5 percentage points.
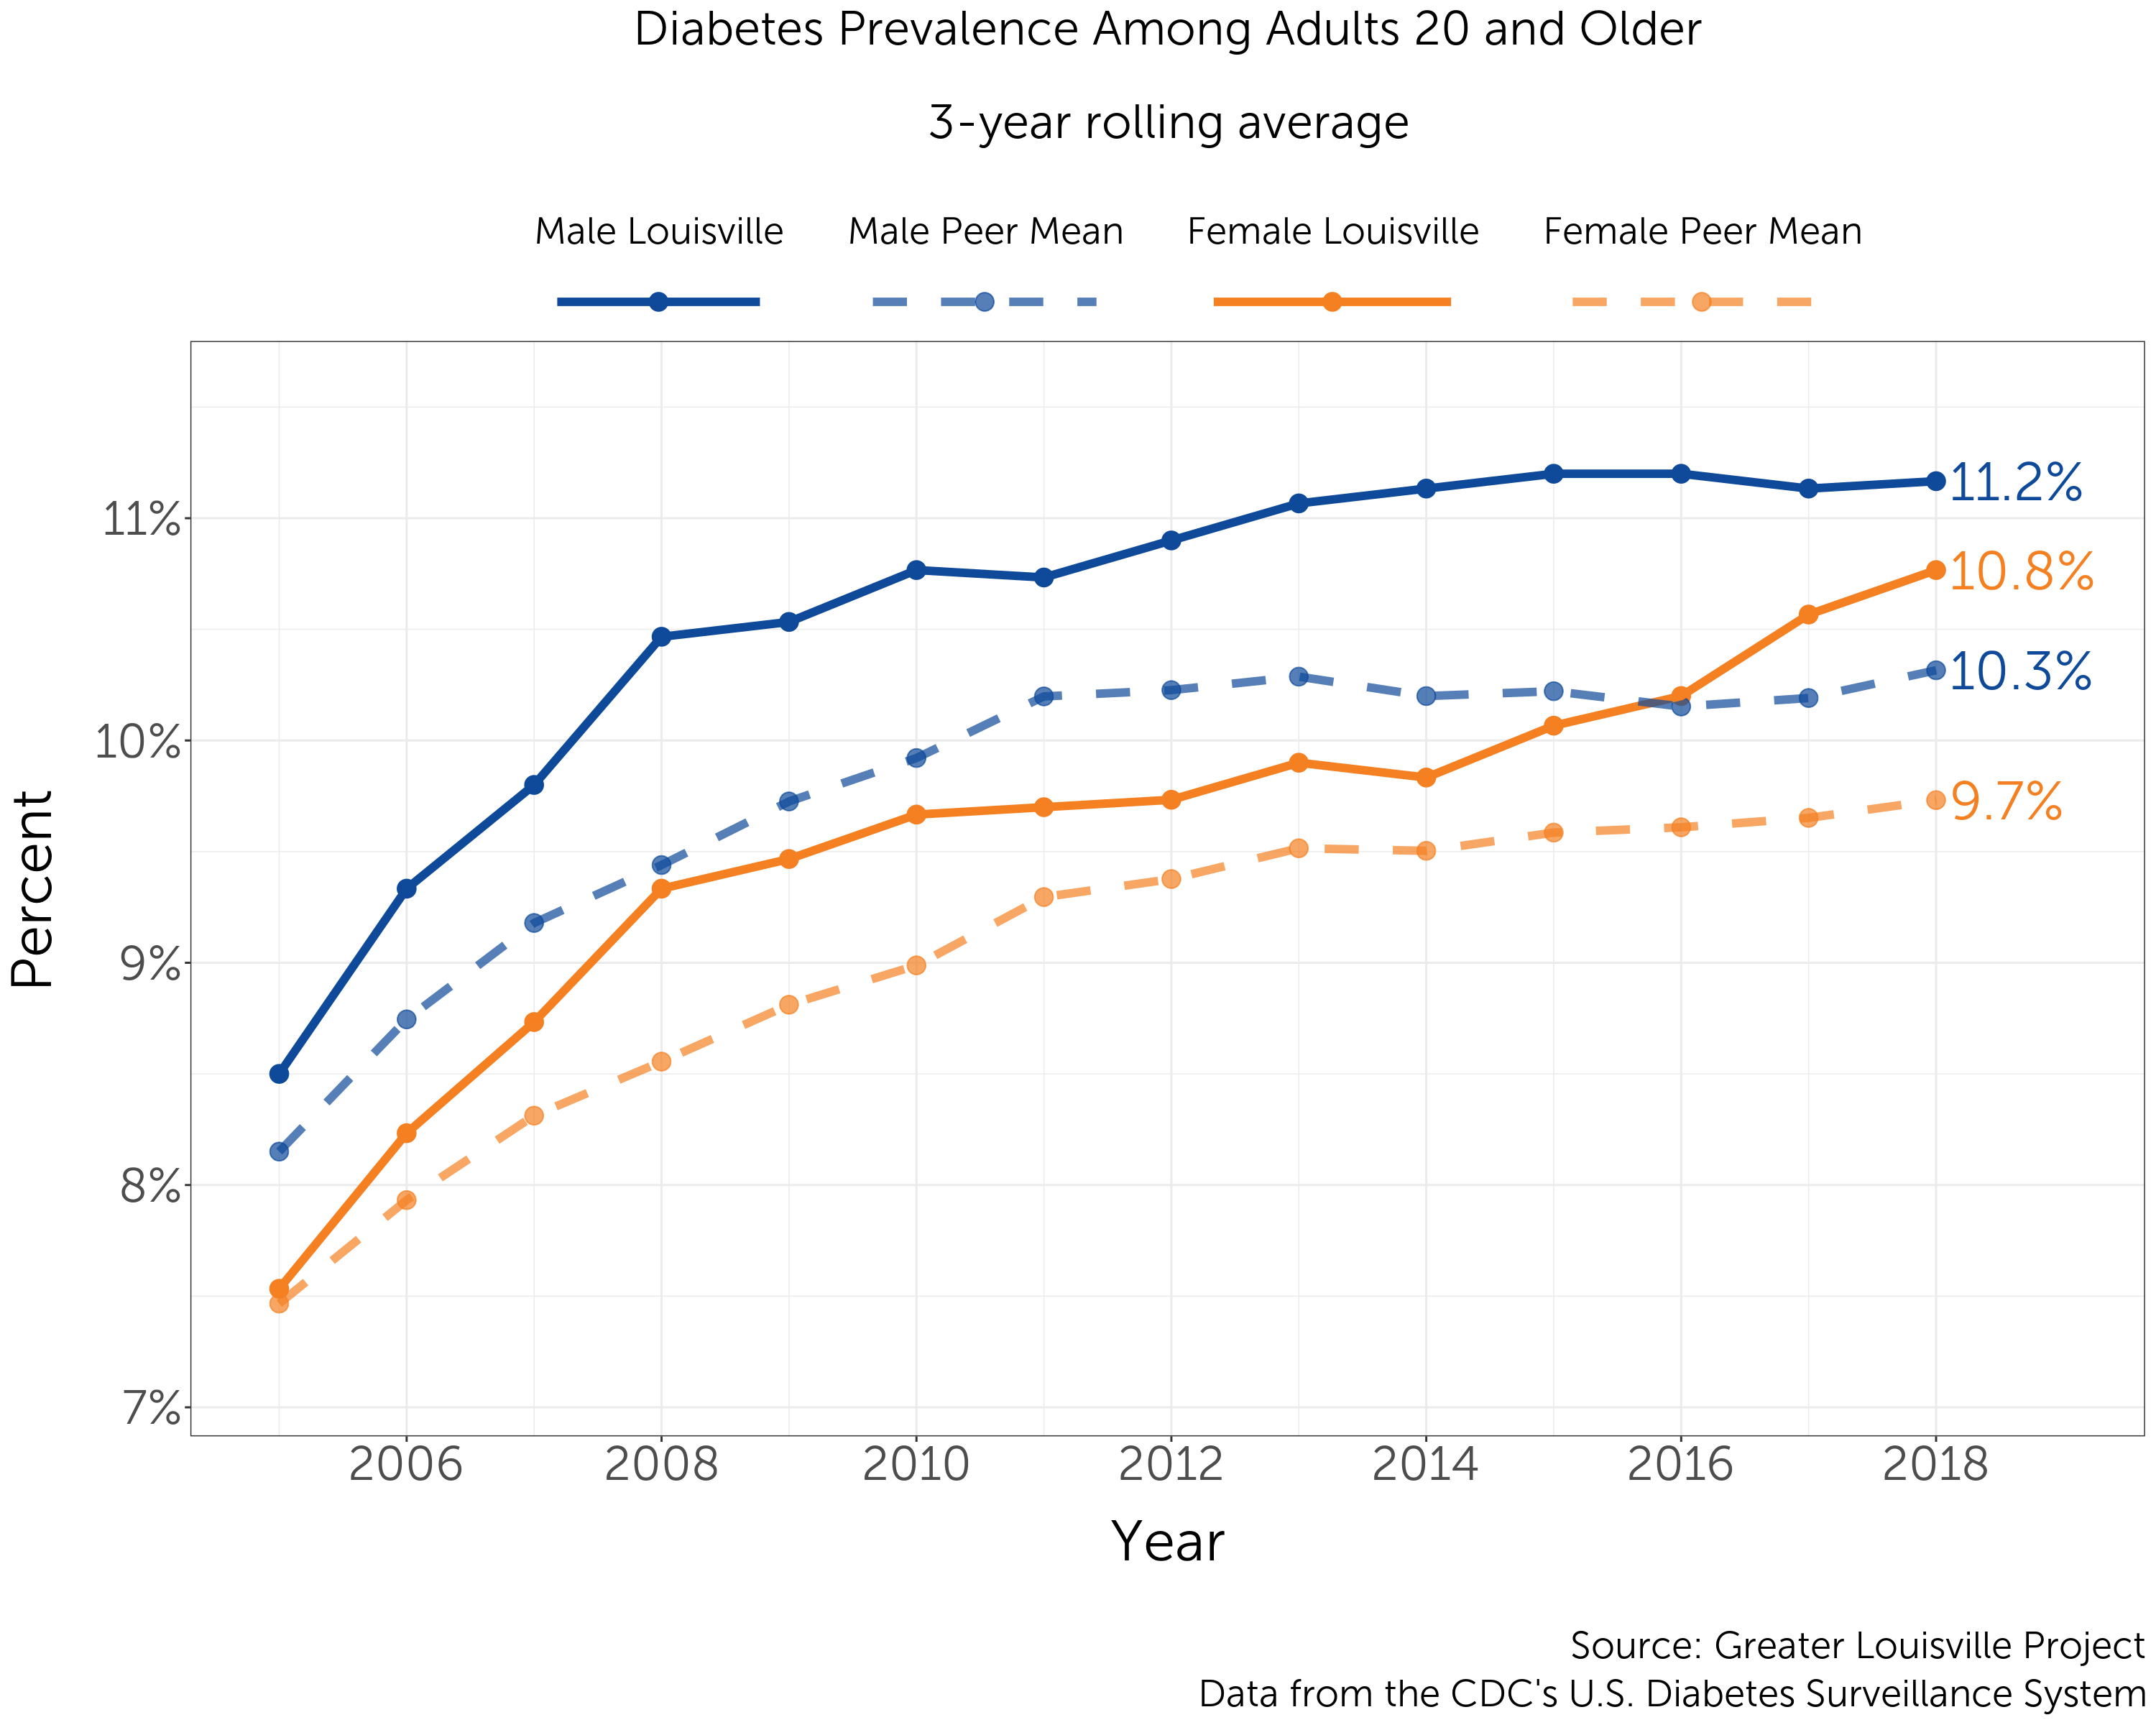
In Louisville, the diabetes rate among men and women largely moved in tandem for much of the last two decades. However, recently, the female diabetes rate has increased more sharply than the male diabetes rate. It now sits at 10.8%, compared with 11.2% for men.
Mammograms play an important role in helping women to spot malignant lumps early, which has the potential to dramatically improve cancer survival rates.
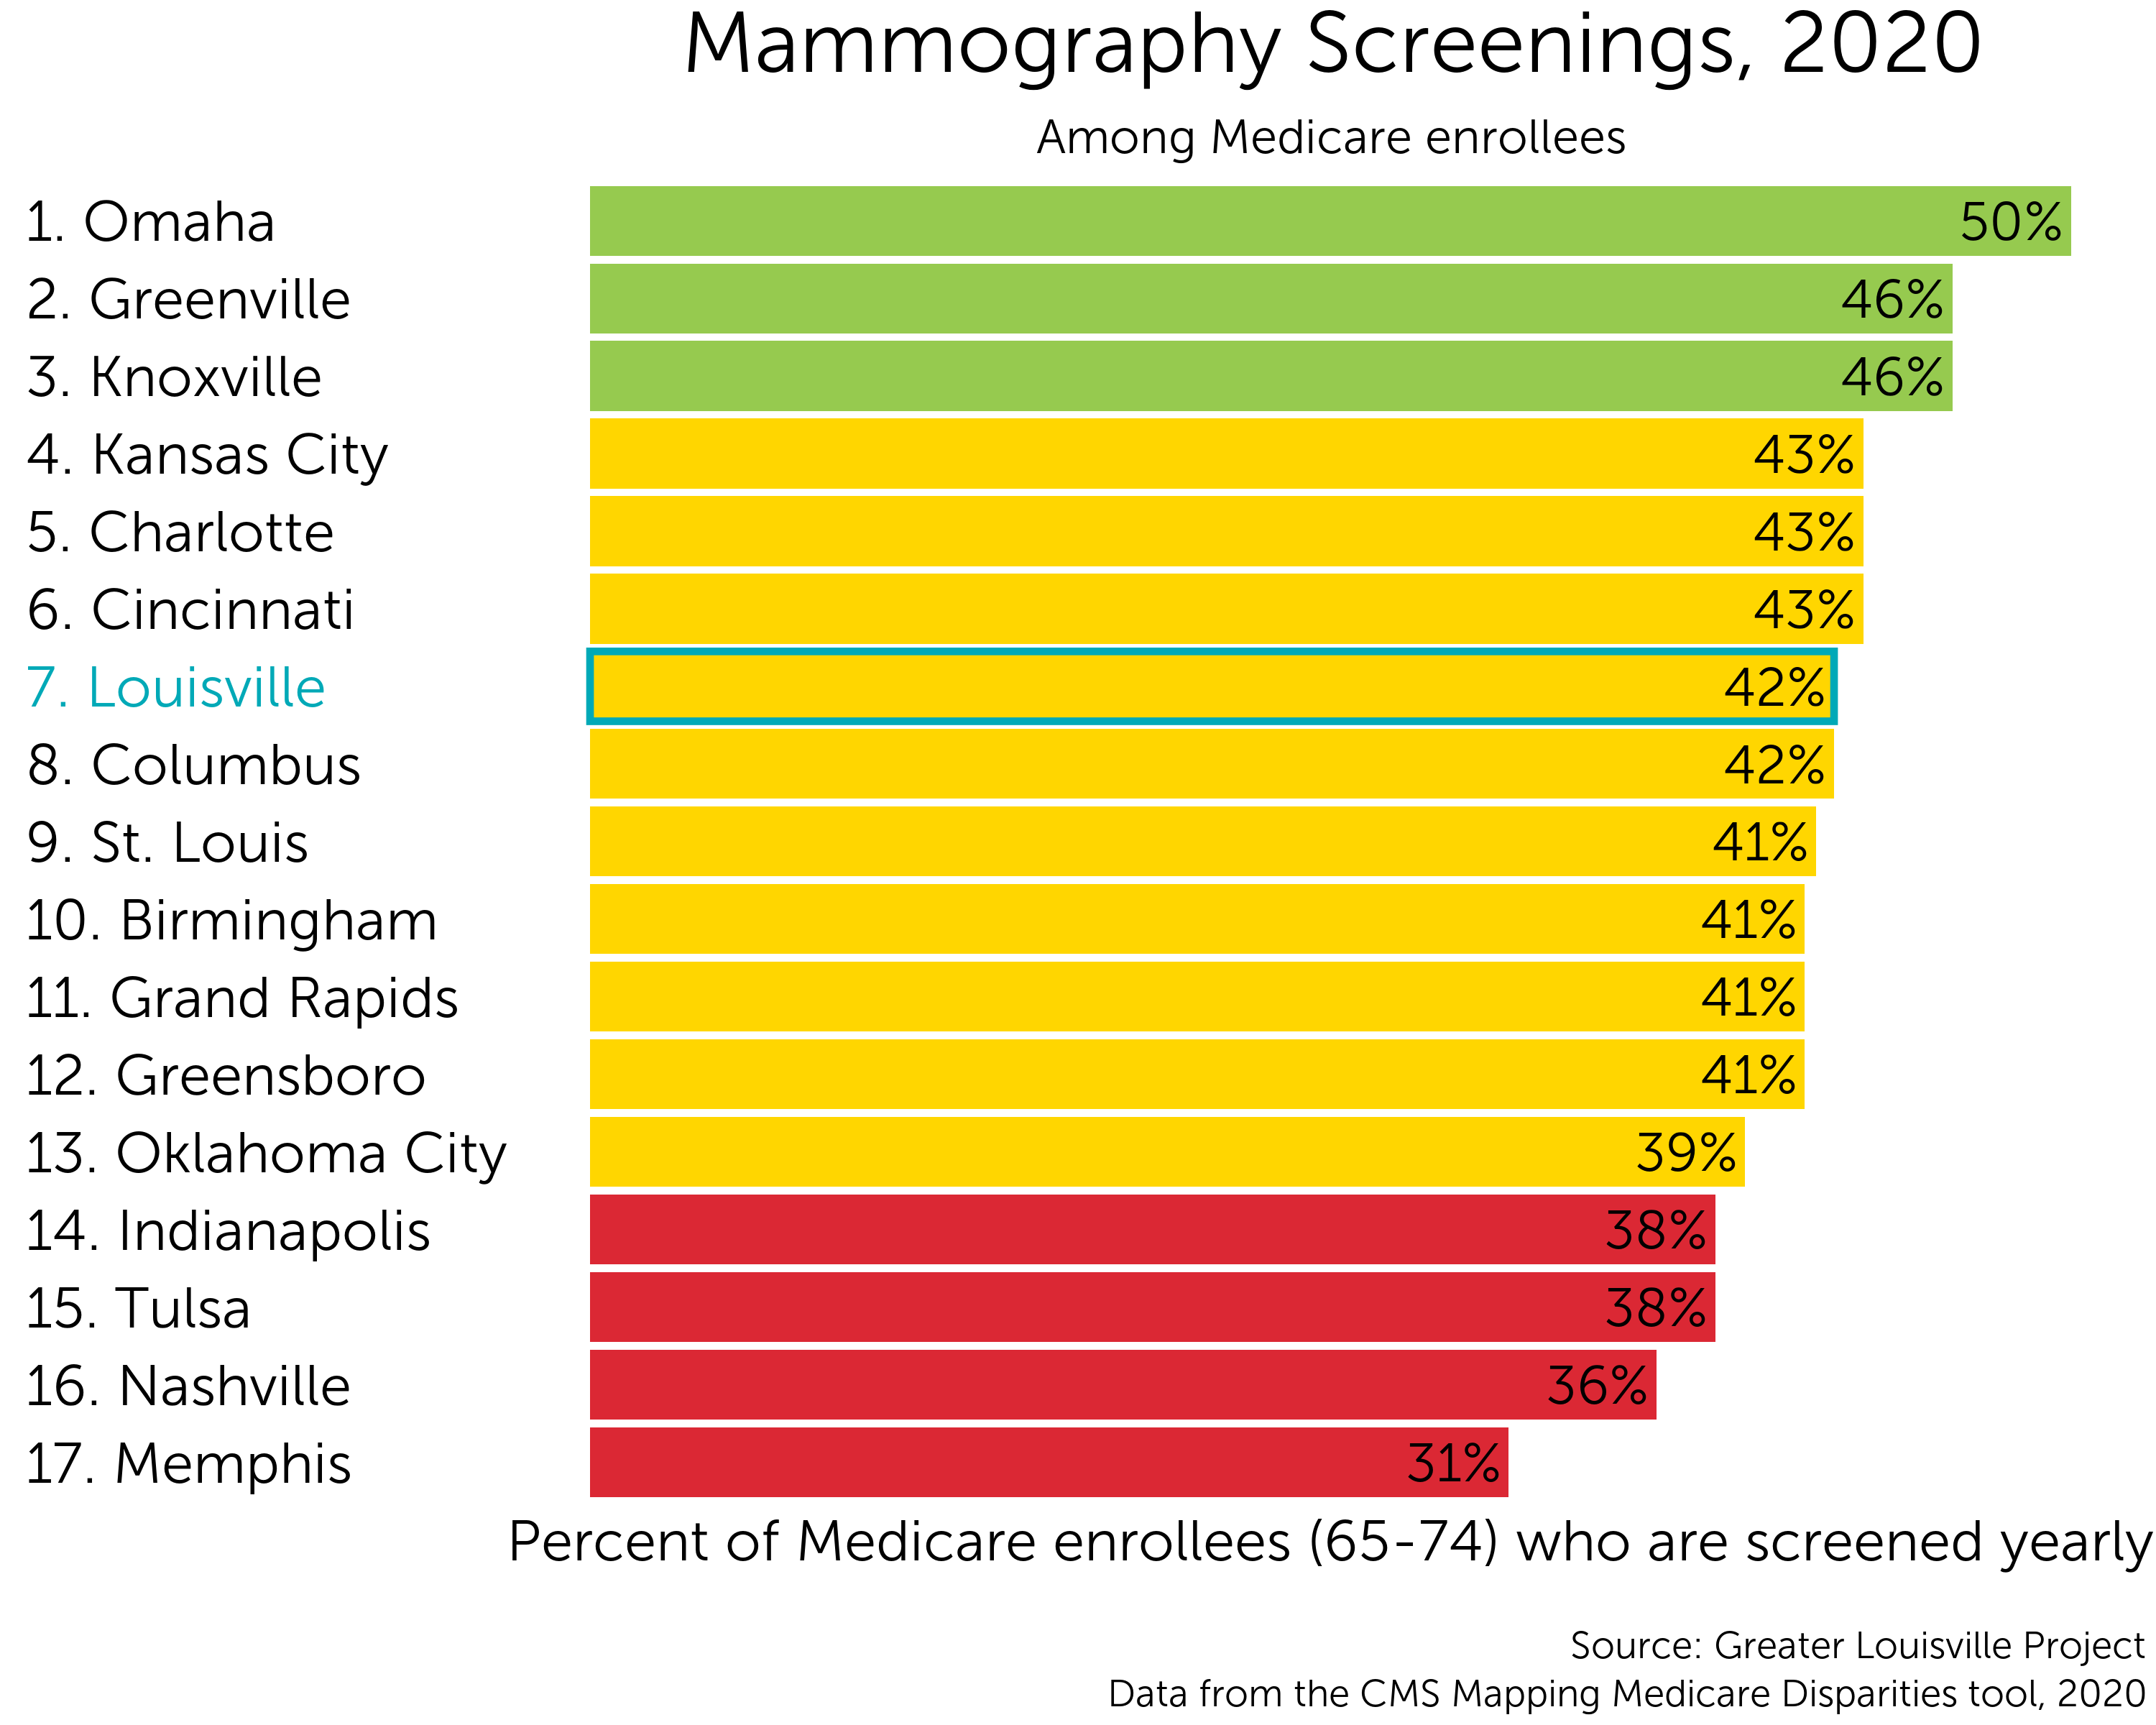
Louisville currently ranks 7th among its peer cities in the percentage of Medicare enrollees between the ages of 65 and 74 who receive yearly mammogram screenings.
Louisville is in the middle tier of its peer group according to a natural breaks algorithm. Cities in green are those that outperform their peers. Cities in yellow represent the middle cluster, and those in red lag behind their peers on this indicator.
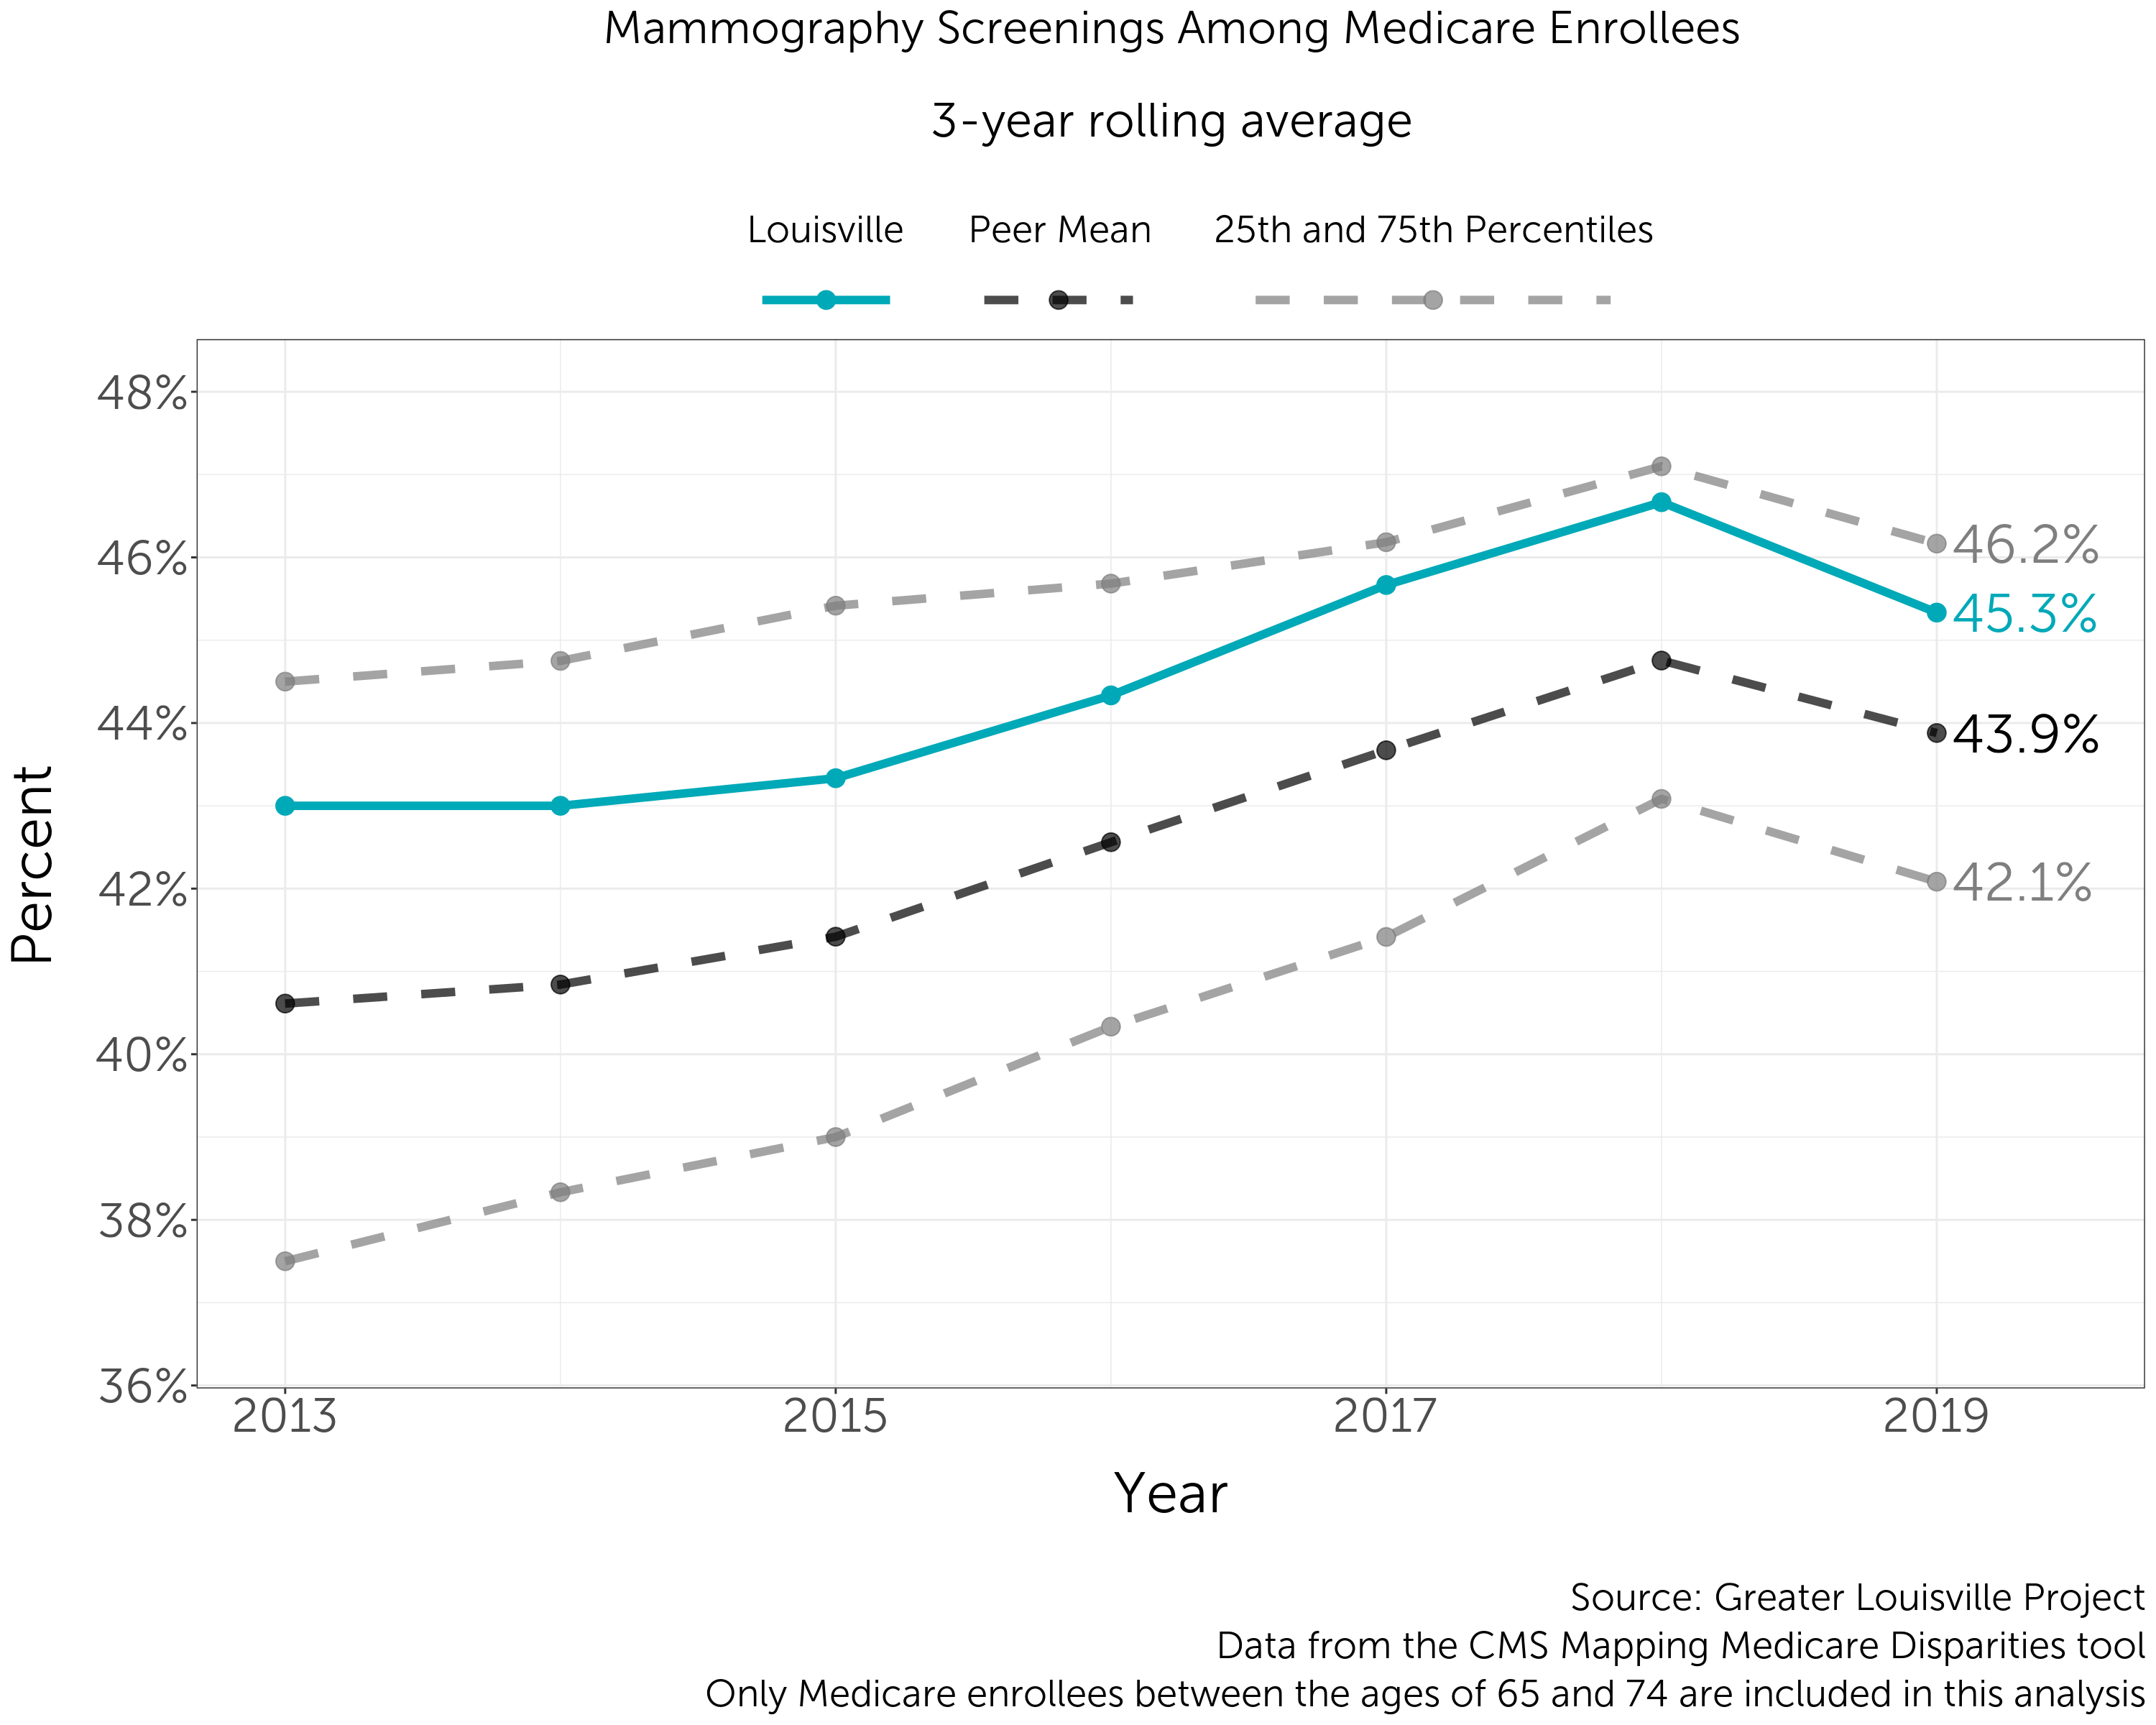
Over the last decade, the percentage of Medicare enrollees between the ages of 65 and 74 who were going in for their yearly mammograms was rising. Recently, across all peer cities, that percentage decreased, likely in large part because the COVID-19 pandemic limited access to these screenings.
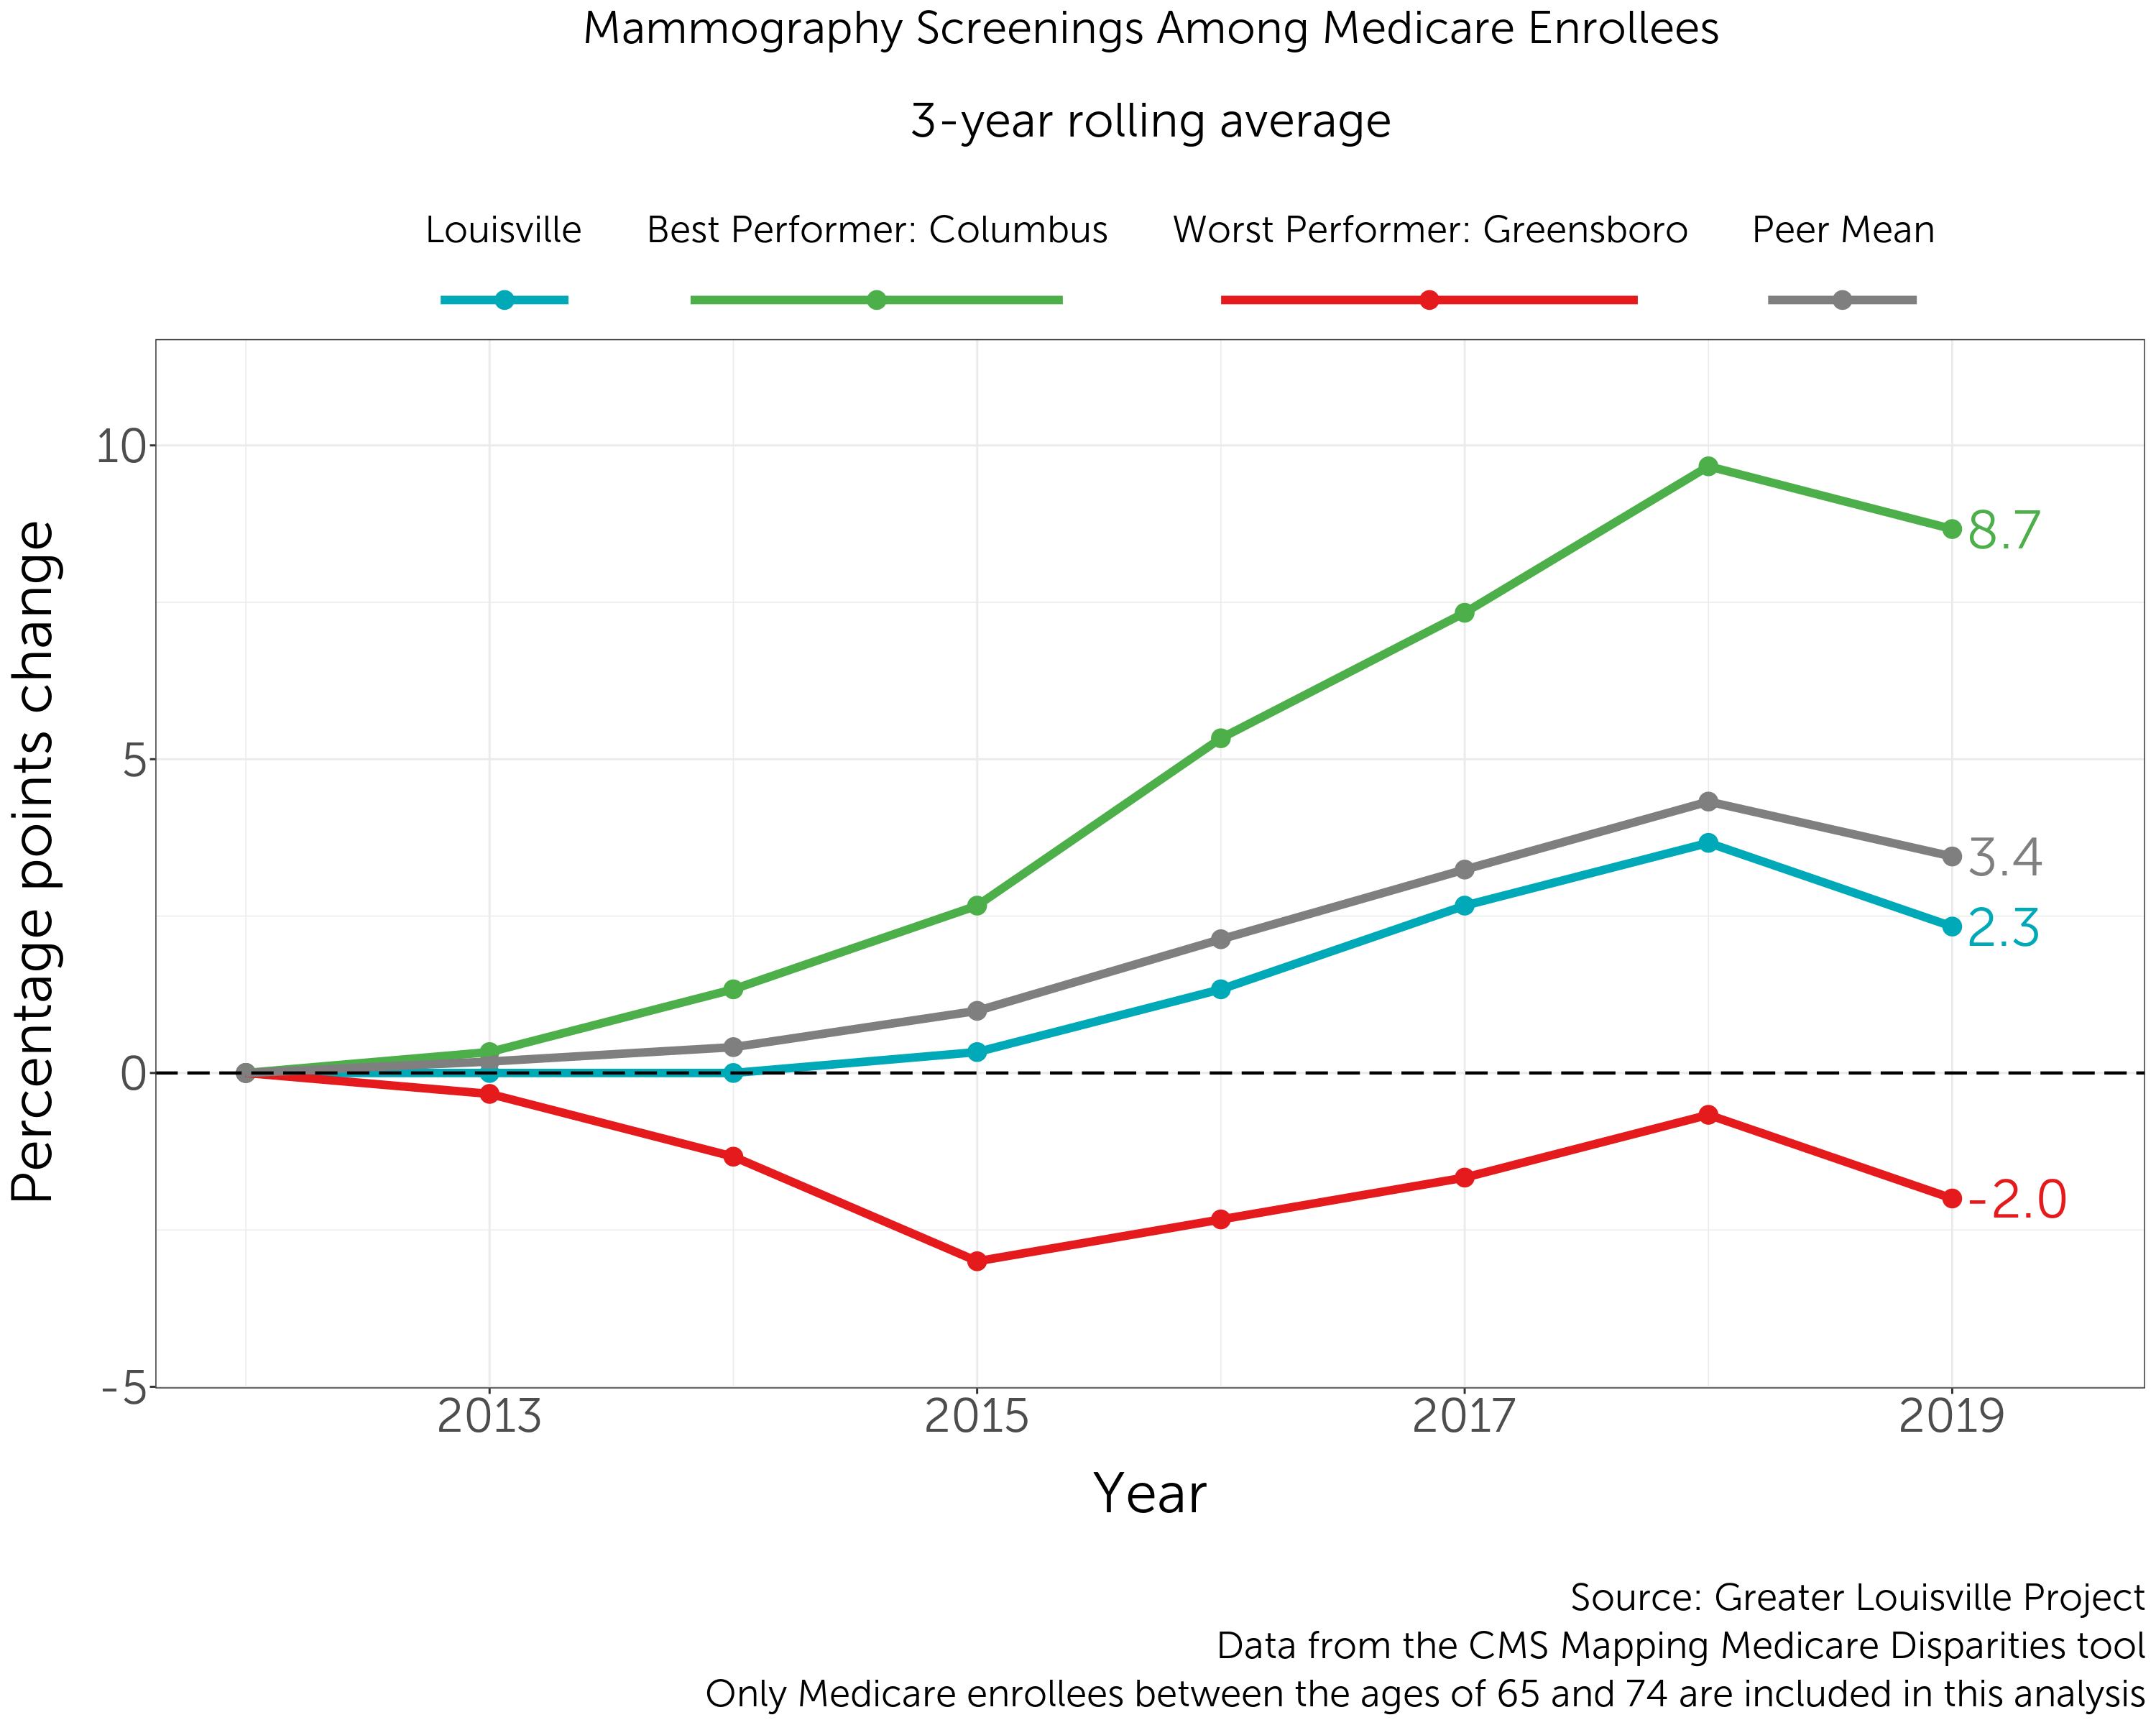
Over the past decade, Greensboro has seen its yearly mammography screenings among Medicare enrollees between the ages of 65 and 74 decrease by 2 percentage points, making it the worst performer of the group. Meanwhile, even with a recent dip in screenings, Columbus saw a nearly 9 percentage point increase in its mammography screenings, making it the best performer. Louisville continues to slightly underperform its peers, on average.
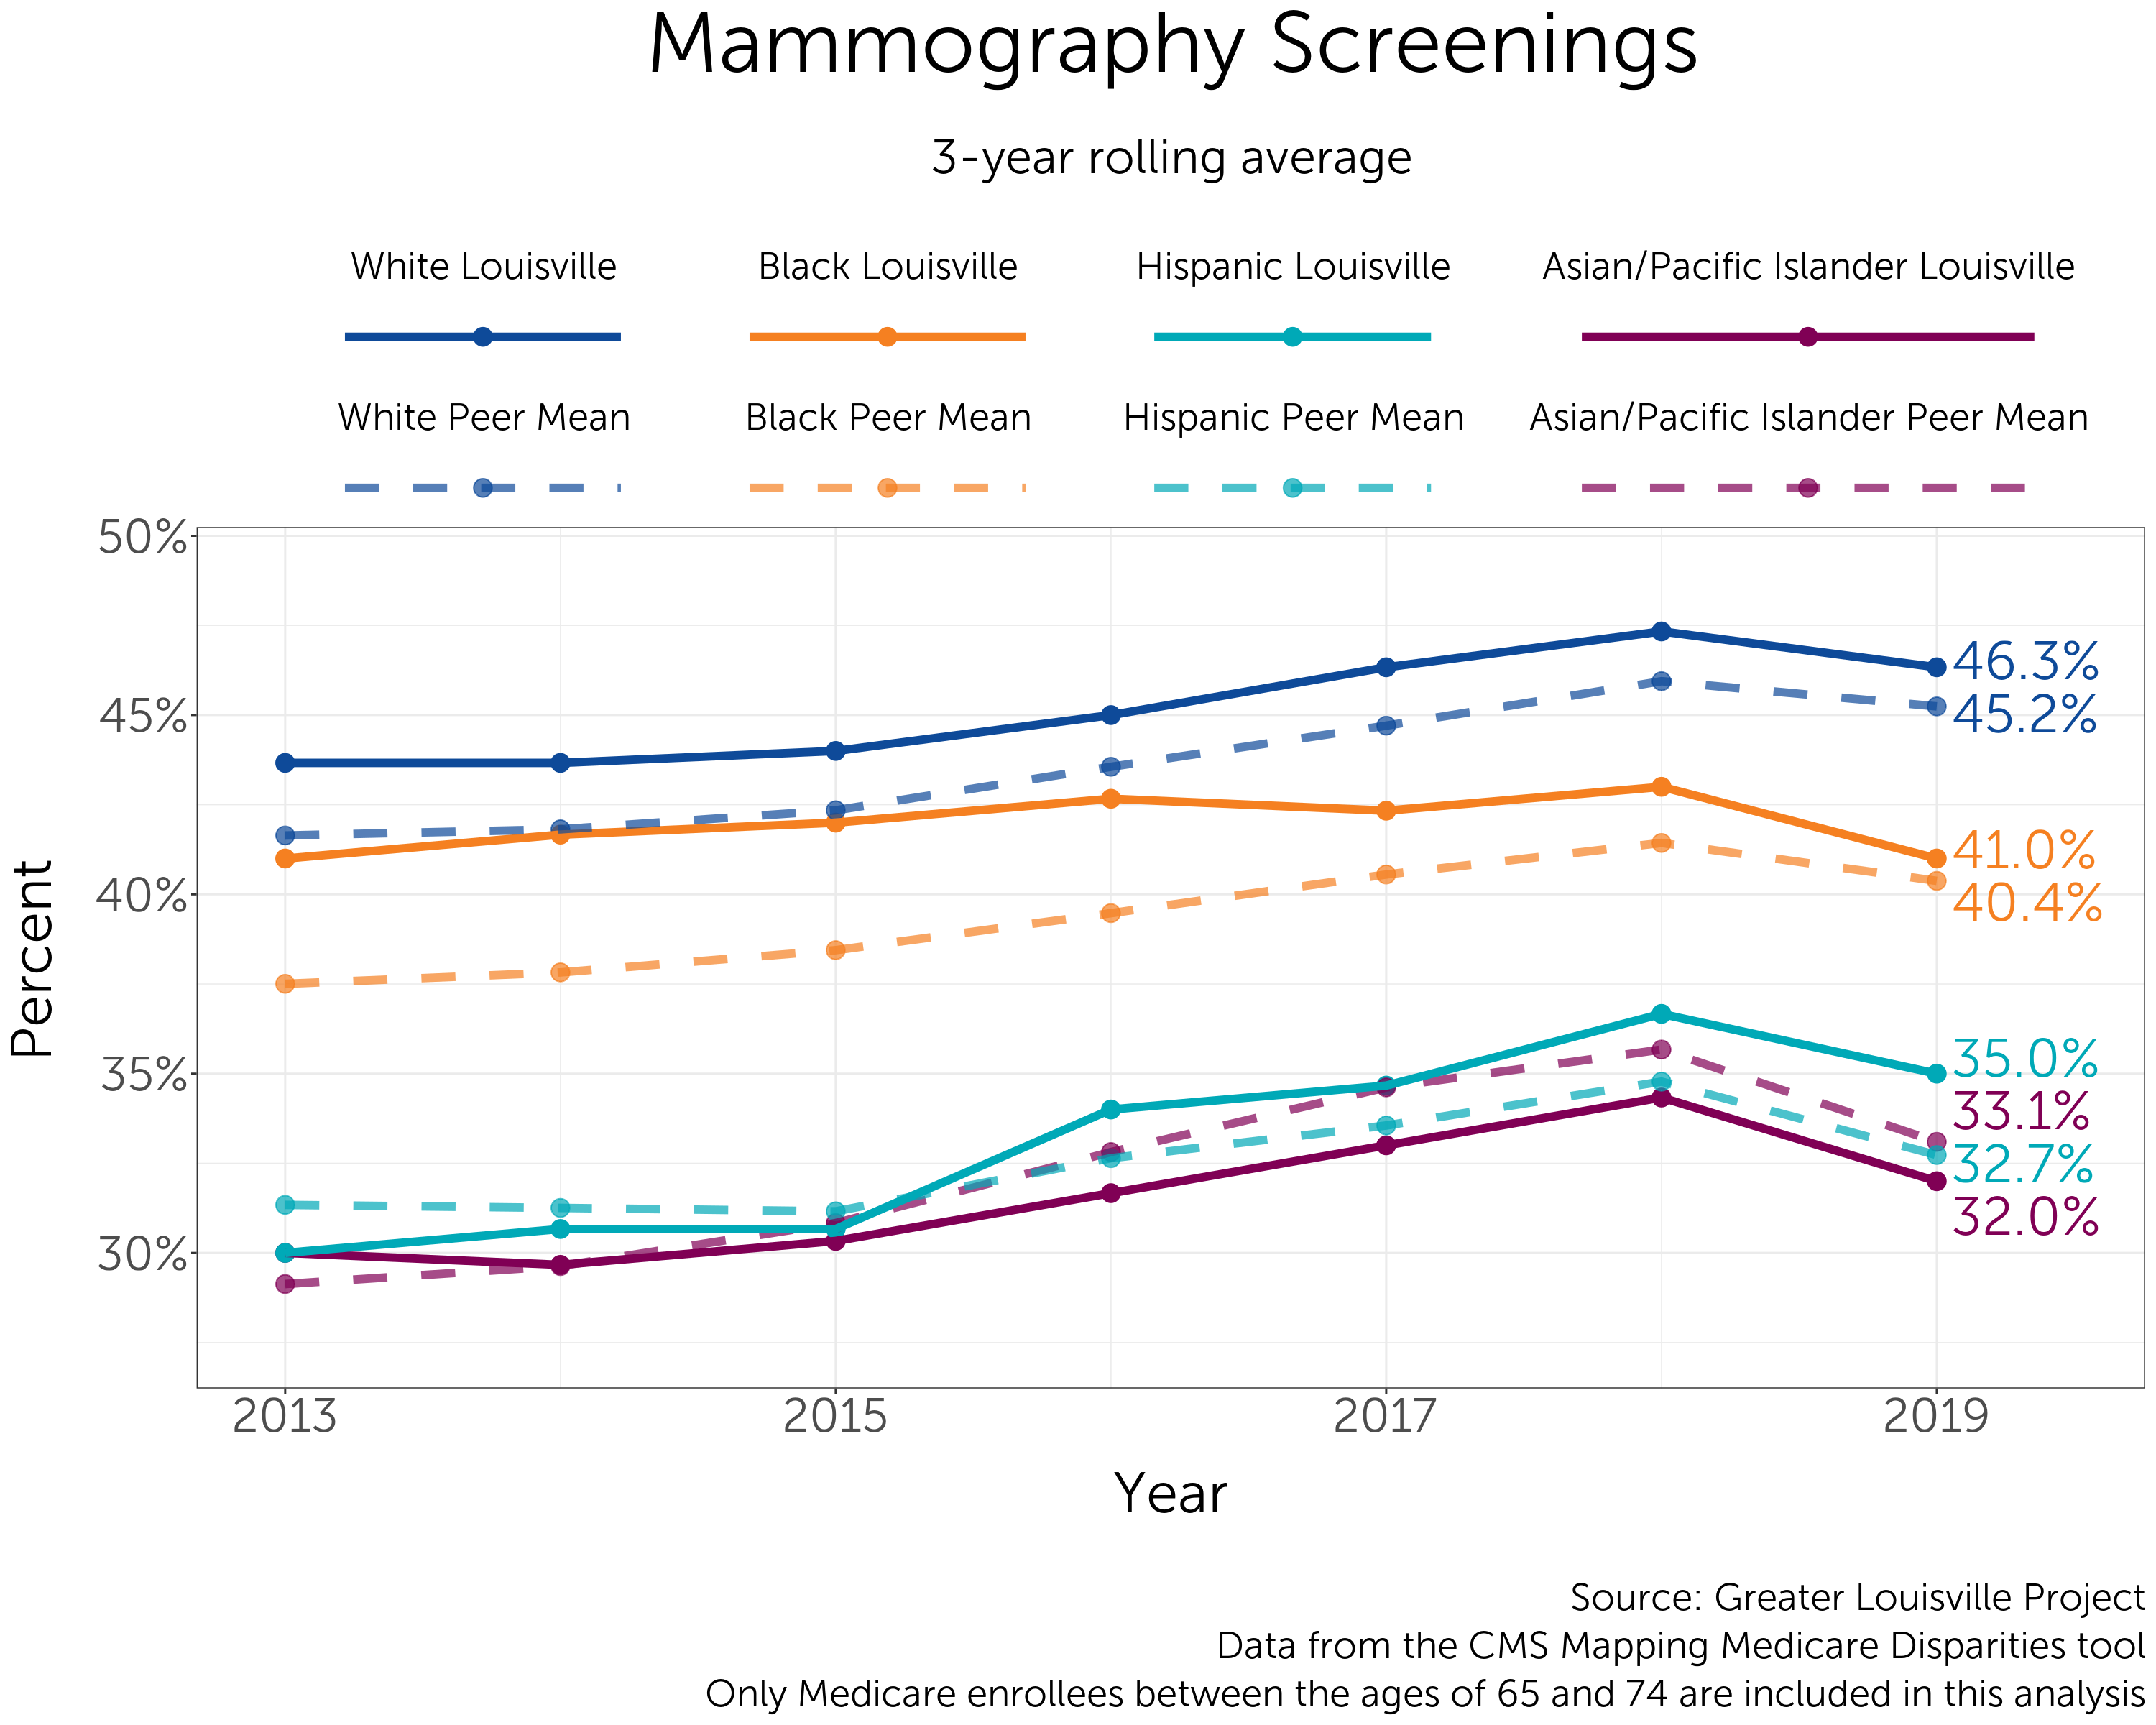
The mammography screening rate of White Medicare enrollees between the ages of 65 and 74 moved in tandem with the rate of Black Medicare enrollees for much of the beginning of the last decade. In recent years, however, the divide between these two groups has widened. The screening rates among Hispanic and Asian/Pacific Islander Medicare enrollees continues to sit well below those of White and Black Medicare enrollees.
For each indicator, Greater Louisville Project assigns cities into one of three groups (high-performing, middle-of-the-pack, and low-performing) based on how they compare to other cities. The assignment is based on how cities naturally cluster on that indicator. Sometimes, the differences between cities are very small, and the difference between a city ranked 5th and 6th could simply be a matter of the sampling error that arises from using survey data. Thus, rather than always make a division that declares the top 5 to be the top tier, we use a natural breaks algorithm to look for a cluster of cities that is outperforming the rest, a cluster that is about average, and a cluster that is lagging. This clustering gives us a better indication of where Louisville is thriving and where Louisville has room to learn from cities that are doing better.
Z-scores (or standardization) is a way to combine data with different units of measurement into a single index. The z-score is a measure of how far away a city (or census tract, etc.) is from the average city. In order to be comparable across different units of measurement, the z-score is the distance from the mean measured in standard deviations (e.g. if Louisville has a z-score of 1 it means Louisville is 1 standard deviation above the mean of its peer cities).
Data from the Robert Wood Johnson Foundation's County Health Rankings use z-scores and all z-scores are relative to the mean of Louisville's peer cities. (On the County Health Rankings site z-scores are relative to all the counties in each state - thus z-scores reported by GLP will be different, because we are using a different reference group). The Greater Louisville Project also uses z-scores in our multidimensional poverty index, which compares each census tract to the mean of all census tracts in Louisville.