Racial Geography

In order to achieve a prosperous community in which all residents can participate fully, high levels of segregation in communities should be reduced. Although complete desegregation is not necessarily a desirable outcome due to the destruction of social capital built from within communities, fostering cultural exchange and horizontal relationships will yield greater economic and social prosperity, and ultimately stronger communities.

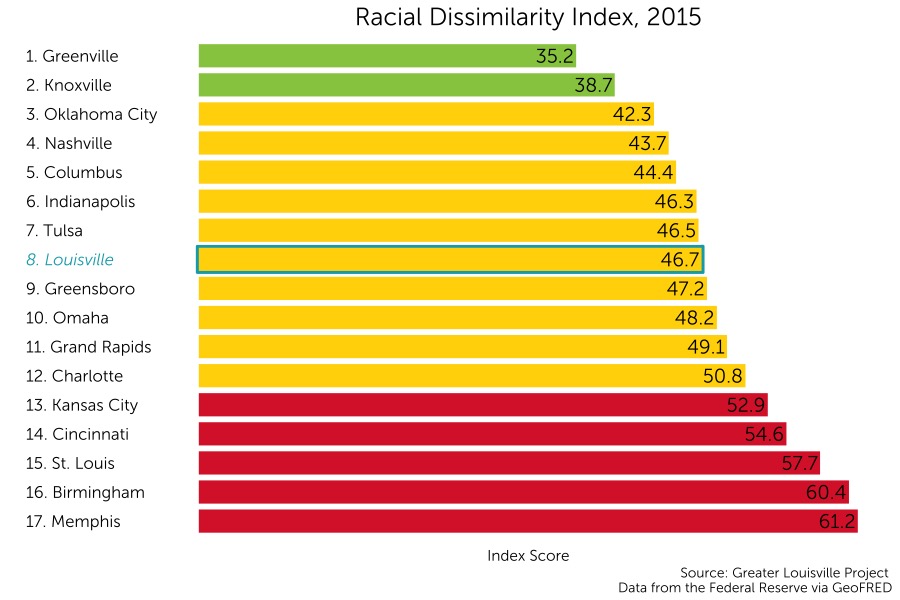
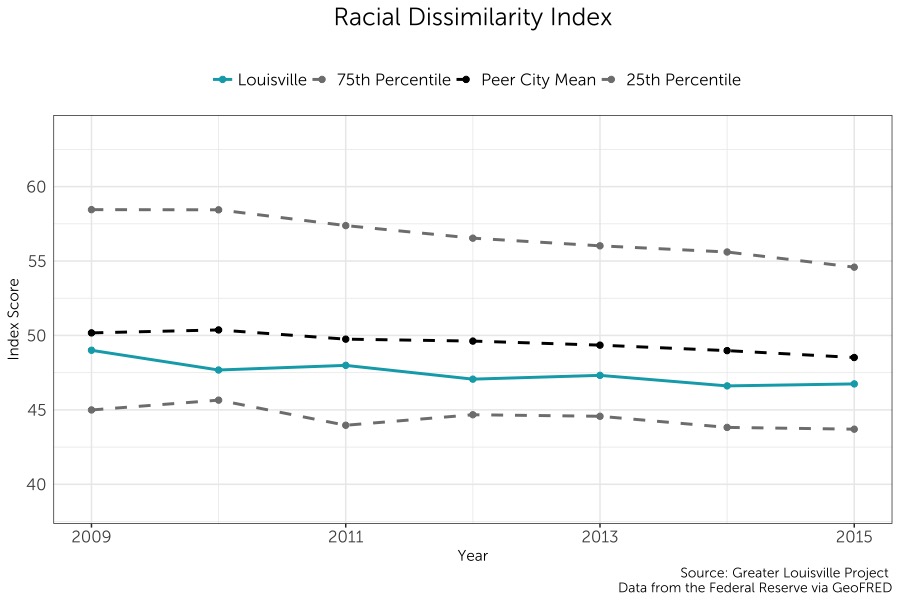
While there are many facets of diversity that one could study when considering segregation, race is most commonly associated with the practice of segregation. The present effects of a history of segregation across geographic and racial lines damage a community’s quality of life and stunt the development of community-wide prosperity and cultural exchange.

Peer City Perspective

Louisville currently ranks 8th among its peers in the index of dissimilarity when considering white and non-white residents. The index of dissimilarity can be interpreted as the percentage of residents in a given city that would be required to move to a new census tract in order to achieve the citywide ratio of white to non-white residents in each census tract, creating greater opportunity for cross-cultural exchange and horizontal relationship building. Higher index values indicate higher levels of segregation.

Louisville ranks among the middle of its peer group according to a natural breaks algorithm. Cities in green are those that outperform their peers, cities in yellow represent the middle cluster, and those in red are a group that lags behind its peers on this indicator.

Where are Minority Residents Concentrated?

Louisville’s minority residents are highly concentrated in the West End and in the Buechel neighborhoods. The percentage of white residents is as low as 0.3% in one tract of Algonquin. The St. Matthews and Southeast Louisville neighborhoods have the highest percentages of white residents.

Scroll over the map to see values for each census tract. Zoom in to see street names that form the boundaries of each tract.

Trends Over Time

The Index of dissimilarity has decreased slowly from 2009 to 2015 in Louisville, suggesting that the city has experienced low-rates of integration since 2009. Louisville has consistently had a lower index score than the average of its peers.

Continue Exploring with Related Data

Food Deserts

Social Associations

Unemployment